Immigrants from Singapore vs Immigrants from Switzerland Single Mother Poverty
COMPARE
Immigrants from Singapore
Immigrants from Switzerland
Single Mother Poverty
Single Mother Poverty Comparison
Immigrants from Singapore
Immigrants from Switzerland
25.8%
SINGLE MOTHER POVERTY
100.0/ 100
METRIC RATING
14th/ 347
METRIC RANK
28.3%
SINGLE MOTHER POVERTY
91.7/ 100
METRIC RATING
124th/ 347
METRIC RANK
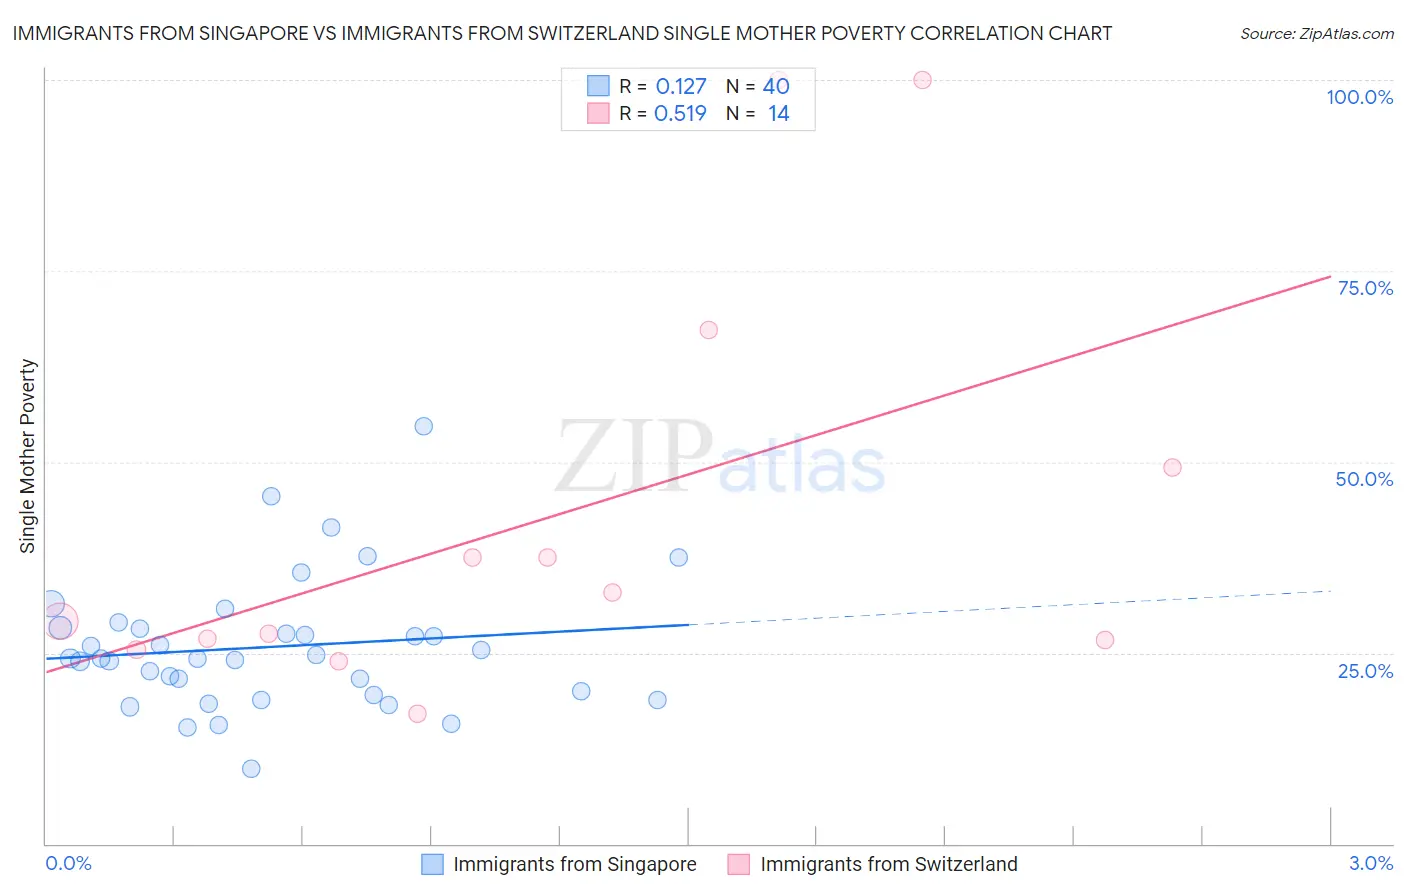
Immigrants from Singapore vs Immigrants from Switzerland Single Mother Poverty Correlation Chart
The statistical analysis conducted on geographies consisting of 135,231,520 people shows a poor positive correlation between the proportion of Immigrants from Singapore and poverty level among single mothers in the United States with a correlation coefficient (R) of 0.127 and weighted average of 25.8%. Similarly, the statistical analysis conducted on geographies consisting of 145,488,343 people shows a substantial positive correlation between the proportion of Immigrants from Switzerland and poverty level among single mothers in the United States with a correlation coefficient (R) of 0.519 and weighted average of 28.3%, a difference of 9.8%.
Single Mother Poverty Correlation Summary
| Measurement | Immigrants from Singapore | Immigrants from Switzerland |
| Minimum | 9.9% | 17.0% |
| Maximum | 54.7% | 100.0% |
| Range | 44.8% | 83.0% |
| Mean | 25.8% | 42.9% |
| Median | 24.2% | 31.0% |
| Interquartile 25% (IQ1) | 19.7% | 26.7% |
| Interquartile 75% (IQ3) | 28.2% | 49.2% |
| Interquartile Range (IQR) | 8.5% | 22.5% |
| Standard Deviation (Sample) | 8.7% | 27.2% |
| Standard Deviation (Population) | 8.5% | 26.2% |
Similar Demographics by Single Mother Poverty
Demographics Similar to Immigrants from Singapore by Single Mother Poverty
In terms of single mother poverty, the demographic groups most similar to Immigrants from Singapore are Indian (Asian) (25.8%, a difference of 0.15%), Immigrants from Ireland (25.8%, a difference of 0.18%), Bolivian (25.9%, a difference of 0.47%), Asian (26.0%, a difference of 0.65%), and Bhutanese (25.6%, a difference of 0.67%).
| Demographics | Rating | Rank | Single Mother Poverty |
| Chinese | 100.0 /100 | #7 | Exceptional 24.6% |
| Immigrants | Iran | 100.0 /100 | #8 | Exceptional 25.1% |
| Immigrants | Lithuania | 100.0 /100 | #9 | Exceptional 25.2% |
| Immigrants | South Central Asia | 100.0 /100 | #10 | Exceptional 25.3% |
| Iranians | 100.0 /100 | #11 | Exceptional 25.5% |
| Bhutanese | 100.0 /100 | #12 | Exceptional 25.6% |
| Indians (Asian) | 100.0 /100 | #13 | Exceptional 25.8% |
| Immigrants | Singapore | 100.0 /100 | #14 | Exceptional 25.8% |
| Immigrants | Ireland | 100.0 /100 | #15 | Exceptional 25.8% |
| Bolivians | 100.0 /100 | #16 | Exceptional 25.9% |
| Asians | 100.0 /100 | #17 | Exceptional 26.0% |
| Immigrants | Pakistan | 100.0 /100 | #18 | Exceptional 26.0% |
| Immigrants | Eastern Asia | 100.0 /100 | #19 | Exceptional 26.1% |
| Immigrants | China | 100.0 /100 | #20 | Exceptional 26.1% |
| Immigrants | Bolivia | 100.0 /100 | #21 | Exceptional 26.2% |
Demographics Similar to Immigrants from Switzerland by Single Mother Poverty
In terms of single mother poverty, the demographic groups most similar to Immigrants from Switzerland are Uruguayan (28.3%, a difference of 0.0%), Colombian (28.3%, a difference of 0.010%), Immigrants from Afghanistan (28.3%, a difference of 0.060%), Cypriot (28.3%, a difference of 0.10%), and Immigrants from Syria (28.3%, a difference of 0.12%).
| Demographics | Rating | Rank | Single Mother Poverty |
| Australians | 92.5 /100 | #117 | Exceptional 28.3% |
| Brazilians | 92.4 /100 | #118 | Exceptional 28.3% |
| Immigrants | Syria | 92.4 /100 | #119 | Exceptional 28.3% |
| Cypriots | 92.3 /100 | #120 | Exceptional 28.3% |
| Immigrants | Afghanistan | 92.1 /100 | #121 | Exceptional 28.3% |
| Colombians | 91.8 /100 | #122 | Exceptional 28.3% |
| Uruguayans | 91.7 /100 | #123 | Exceptional 28.3% |
| Immigrants | Switzerland | 91.7 /100 | #124 | Exceptional 28.3% |
| Kenyans | 90.9 /100 | #125 | Exceptional 28.4% |
| Immigrants | Chile | 90.8 /100 | #126 | Exceptional 28.4% |
| Poles | 90.8 /100 | #127 | Exceptional 28.4% |
| Immigrants | England | 90.5 /100 | #128 | Exceptional 28.4% |
| South Americans | 90.4 /100 | #129 | Exceptional 28.4% |
| Norwegians | 90.4 /100 | #130 | Exceptional 28.4% |
| Immigrants | Austria | 90.3 /100 | #131 | Exceptional 28.4% |