Guatemalan vs Potawatomi Female Poverty Among 18-24 Year Olds
COMPARE
Guatemalan
Potawatomi
Female Poverty Among 18-24 Year Olds
Female Poverty Among 18-24 Year Olds Comparison
Guatemalans
Potawatomi
20.7%
FEMALE POVERTY AMONG 18-24 YEAR OLDS
8.1/ 100
METRIC RATING
222nd/ 347
METRIC RANK
23.7%
FEMALE POVERTY AMONG 18-24 YEAR OLDS
0.0/ 100
METRIC RATING
311th/ 347
METRIC RANK
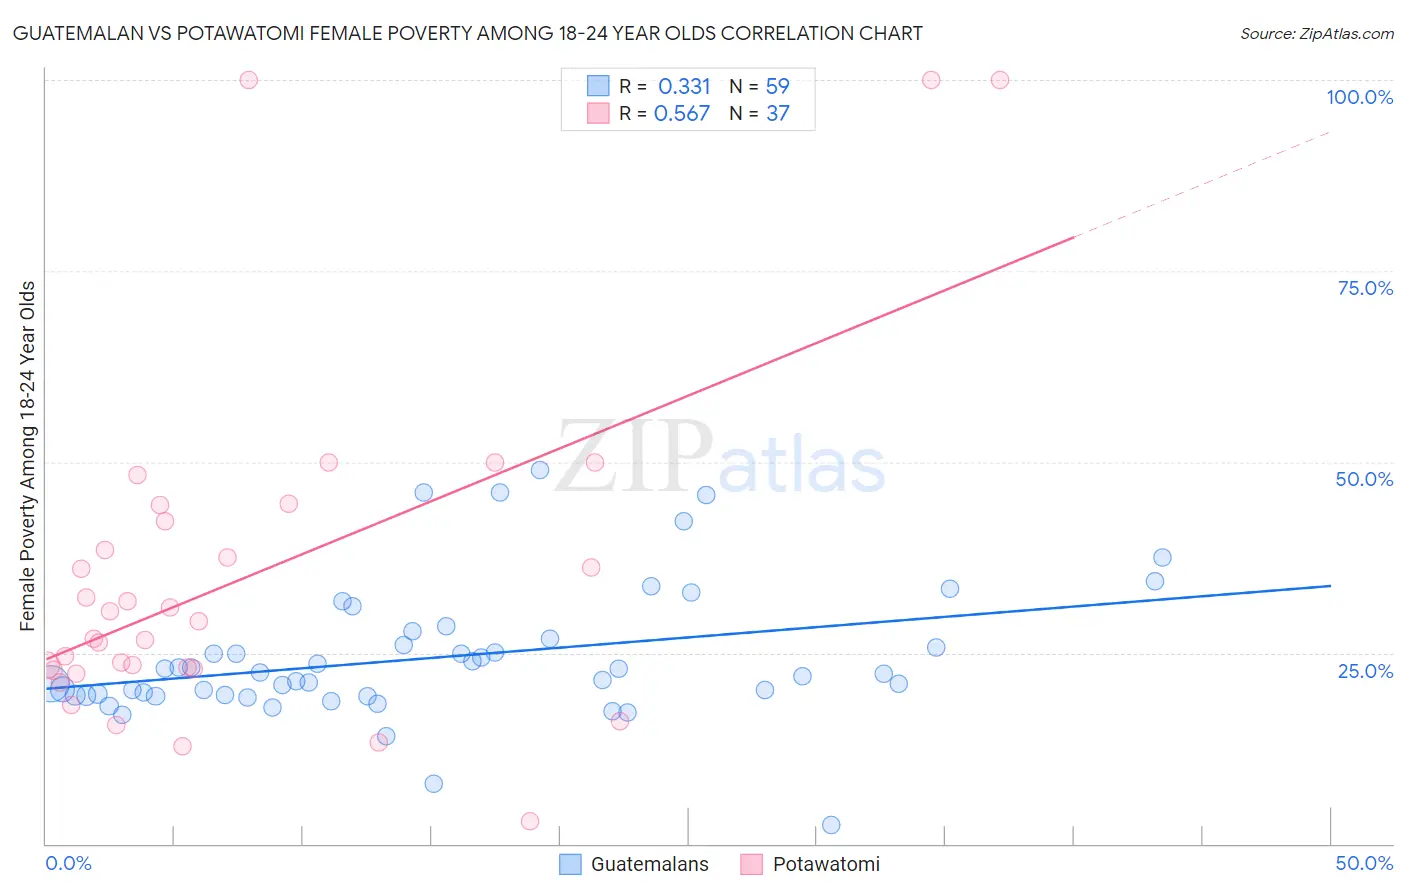
Guatemalan vs Potawatomi Female Poverty Among 18-24 Year Olds Correlation Chart
The statistical analysis conducted on geographies consisting of 400,967,601 people shows a mild positive correlation between the proportion of Guatemalans and poverty level among females between the ages 18 and 24 in the United States with a correlation coefficient (R) of 0.331 and weighted average of 20.7%. Similarly, the statistical analysis conducted on geographies consisting of 116,785,145 people shows a substantial positive correlation between the proportion of Potawatomi and poverty level among females between the ages 18 and 24 in the United States with a correlation coefficient (R) of 0.567 and weighted average of 23.7%, a difference of 14.4%.
Female Poverty Among 18-24 Year Olds Correlation Summary
| Measurement | Guatemalan | Potawatomi |
| Minimum | 2.4% | 3.0% |
| Maximum | 49.0% | 100.0% |
| Range | 46.6% | 97.0% |
| Mean | 24.4% | 35.1% |
| Median | 22.2% | 29.2% |
| Interquartile 25% (IQ1) | 19.4% | 22.8% |
| Interquartile 75% (IQ3) | 26.9% | 43.3% |
| Interquartile Range (IQR) | 7.5% | 20.5% |
| Standard Deviation (Sample) | 8.8% | 22.6% |
| Standard Deviation (Population) | 8.7% | 22.3% |
Similar Demographics by Female Poverty Among 18-24 Year Olds
Demographics Similar to Guatemalans by Female Poverty Among 18-24 Year Olds
In terms of female poverty among 18-24 year olds, the demographic groups most similar to Guatemalans are French (20.7%, a difference of 0.030%), Immigrants from Liberia (20.7%, a difference of 0.070%), Norwegian (20.7%, a difference of 0.13%), Barbadian (20.7%, a difference of 0.14%), and Estonian (20.7%, a difference of 0.15%).
| Demographics | Rating | Rank | Female Poverty Among 18-24 Year Olds |
| Spanish | 10.4 /100 | #215 | Poor 20.6% |
| Immigrants | Western Africa | 10.2 /100 | #216 | Poor 20.6% |
| Immigrants | Laos | 9.7 /100 | #217 | Tragic 20.6% |
| Immigrants | Nepal | 9.6 /100 | #218 | Tragic 20.7% |
| Immigrants | Micronesia | 9.6 /100 | #219 | Tragic 20.7% |
| British | 9.4 /100 | #220 | Tragic 20.7% |
| Barbadians | 9.0 /100 | #221 | Tragic 20.7% |
| Guatemalans | 8.1 /100 | #222 | Tragic 20.7% |
| French | 7.9 /100 | #223 | Tragic 20.7% |
| Immigrants | Liberia | 7.6 /100 | #224 | Tragic 20.7% |
| Norwegians | 7.3 /100 | #225 | Tragic 20.7% |
| Estonians | 7.2 /100 | #226 | Tragic 20.7% |
| Immigrants | Sweden | 6.8 /100 | #227 | Tragic 20.7% |
| Ghanaians | 6.5 /100 | #228 | Tragic 20.8% |
| Australians | 6.1 /100 | #229 | Tragic 20.8% |
Demographics Similar to Potawatomi by Female Poverty Among 18-24 Year Olds
In terms of female poverty among 18-24 year olds, the demographic groups most similar to Potawatomi are Comanche (23.6%, a difference of 0.29%), Blackfeet (23.6%, a difference of 0.34%), Immigrants from Sudan (23.5%, a difference of 0.79%), Cree (23.4%, a difference of 1.1%), and Yuman (24.0%, a difference of 1.2%).
| Demographics | Rating | Rank | Female Poverty Among 18-24 Year Olds |
| Sudanese | 0.0 /100 | #304 | Tragic 23.0% |
| Immigrants | Kuwait | 0.0 /100 | #305 | Tragic 23.0% |
| Paiute | 0.0 /100 | #306 | Tragic 23.3% |
| Cree | 0.0 /100 | #307 | Tragic 23.4% |
| Immigrants | Sudan | 0.0 /100 | #308 | Tragic 23.5% |
| Blackfeet | 0.0 /100 | #309 | Tragic 23.6% |
| Comanche | 0.0 /100 | #310 | Tragic 23.6% |
| Potawatomi | 0.0 /100 | #311 | Tragic 23.7% |
| Yuman | 0.0 /100 | #312 | Tragic 24.0% |
| Creek | 0.0 /100 | #313 | Tragic 24.2% |
| Choctaw | 0.0 /100 | #314 | Tragic 24.3% |
| Blacks/African Americans | 0.0 /100 | #315 | Tragic 24.3% |
| Alsatians | 0.0 /100 | #316 | Tragic 24.4% |
| Osage | 0.0 /100 | #317 | Tragic 24.5% |
| Chickasaw | 0.0 /100 | #318 | Tragic 24.5% |