Greek vs Immigrants from Eritrea Child Poverty Among Girls Under 16
COMPARE
Greek
Immigrants from Eritrea
Child Poverty Among Girls Under 16
Child Poverty Among Girls Under 16 Comparison
Greeks
Immigrants from Eritrea
14.2%
CHILD POVERTY AMONG GIRLS UNDER 16
99.2/ 100
METRIC RATING
49th/ 347
METRIC RANK
18.7%
CHILD POVERTY AMONG GIRLS UNDER 16
1.0/ 100
METRIC RATING
238th/ 347
METRIC RANK
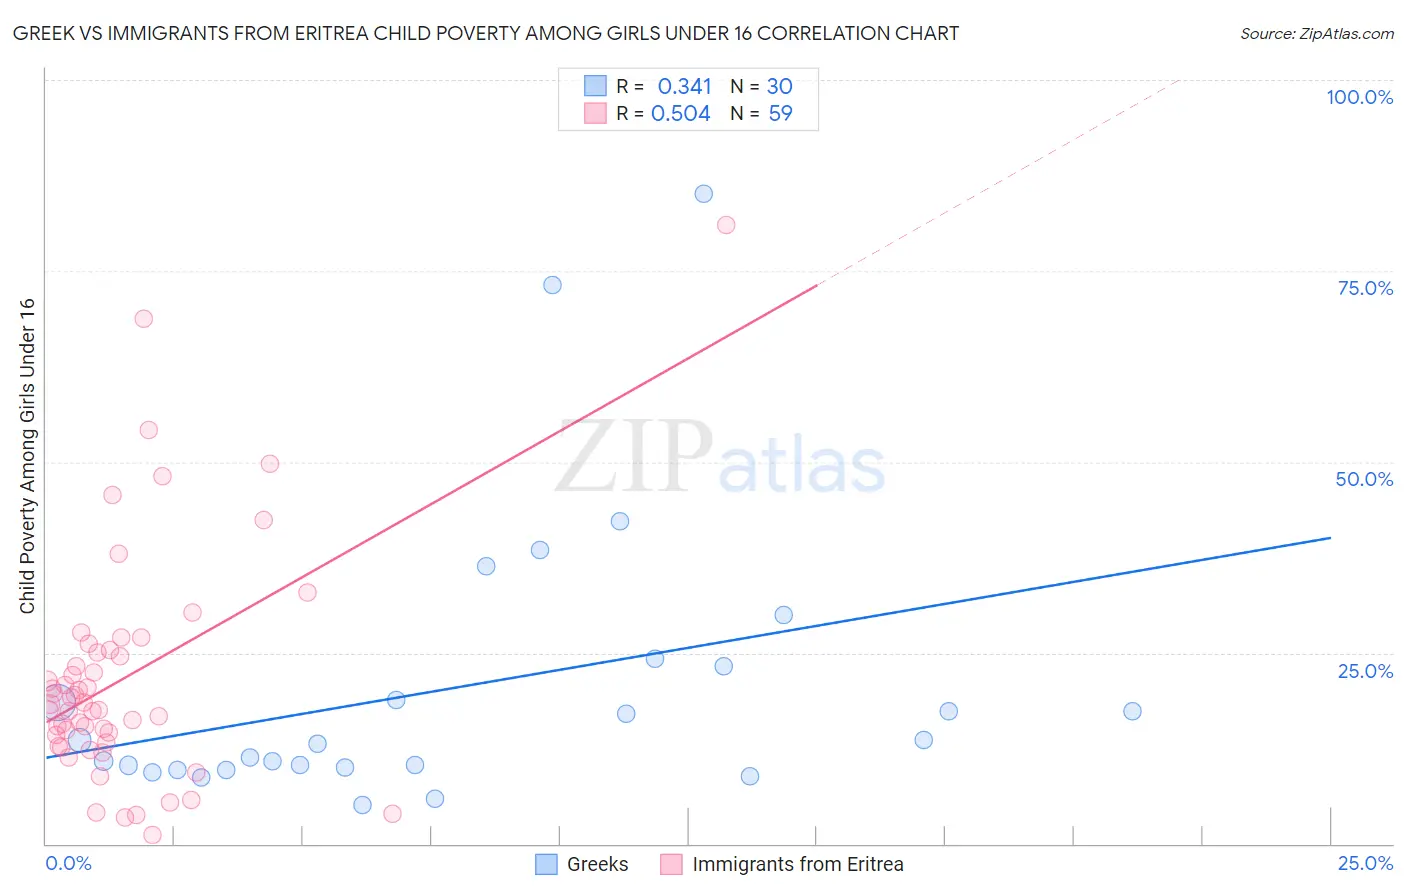
Greek vs Immigrants from Eritrea Child Poverty Among Girls Under 16 Correlation Chart
The statistical analysis conducted on geographies consisting of 468,807,341 people shows a mild positive correlation between the proportion of Greeks and poverty level among girls under the age of 16 in the United States with a correlation coefficient (R) of 0.341 and weighted average of 14.2%. Similarly, the statistical analysis conducted on geographies consisting of 104,454,730 people shows a substantial positive correlation between the proportion of Immigrants from Eritrea and poverty level among girls under the age of 16 in the United States with a correlation coefficient (R) of 0.504 and weighted average of 18.7%, a difference of 31.8%.
Child Poverty Among Girls Under 16 Correlation Summary
| Measurement | Greek | Immigrants from Eritrea |
| Minimum | 5.0% | 1.2% |
| Maximum | 85.1% | 81.0% |
| Range | 80.1% | 79.8% |
| Mean | 20.4% | 21.7% |
| Median | 13.3% | 18.3% |
| Interquartile 25% (IQ1) | 10.0% | 13.2% |
| Interquartile 75% (IQ3) | 23.2% | 25.3% |
| Interquartile Range (IQR) | 13.2% | 12.1% |
| Standard Deviation (Sample) | 18.6% | 15.2% |
| Standard Deviation (Population) | 18.3% | 15.1% |
Similar Demographics by Child Poverty Among Girls Under 16
Demographics Similar to Greeks by Child Poverty Among Girls Under 16
In terms of child poverty among girls under 16, the demographic groups most similar to Greeks are Czech (14.2%, a difference of 0.040%), Immigrants from Czechoslovakia (14.2%, a difference of 0.060%), Immigrants from Israel (14.2%, a difference of 0.070%), Croatian (14.1%, a difference of 0.080%), and Immigrants from Greece (14.1%, a difference of 0.11%).
| Demographics | Rating | Rank | Child Poverty Among Girls Under 16 |
| Immigrants | Scotland | 99.4 /100 | #42 | Exceptional 14.0% |
| Koreans | 99.4 /100 | #43 | Exceptional 14.1% |
| Immigrants | Asia | 99.4 /100 | #44 | Exceptional 14.1% |
| Immigrants | Greece | 99.3 /100 | #45 | Exceptional 14.1% |
| Croatians | 99.3 /100 | #46 | Exceptional 14.1% |
| Immigrants | Czechoslovakia | 99.3 /100 | #47 | Exceptional 14.2% |
| Czechs | 99.3 /100 | #48 | Exceptional 14.2% |
| Greeks | 99.2 /100 | #49 | Exceptional 14.2% |
| Immigrants | Israel | 99.2 /100 | #50 | Exceptional 14.2% |
| Immigrants | Pakistan | 99.1 /100 | #51 | Exceptional 14.2% |
| Italians | 99.1 /100 | #52 | Exceptional 14.3% |
| Luxembourgers | 99.0 /100 | #53 | Exceptional 14.3% |
| Estonians | 98.9 /100 | #54 | Exceptional 14.3% |
| Immigrants | Romania | 98.9 /100 | #55 | Exceptional 14.3% |
| Immigrants | Indonesia | 98.9 /100 | #56 | Exceptional 14.4% |
Demographics Similar to Immigrants from Eritrea by Child Poverty Among Girls Under 16
In terms of child poverty among girls under 16, the demographic groups most similar to Immigrants from Eritrea are Marshallese (18.7%, a difference of 0.070%), Immigrants from Nigeria (18.6%, a difference of 0.14%), Nigerian (18.7%, a difference of 0.21%), Alsatian (18.6%, a difference of 0.27%), and Nepalese (18.6%, a difference of 0.28%).
| Demographics | Rating | Rank | Child Poverty Among Girls Under 16 |
| Cree | 1.3 /100 | #231 | Tragic 18.5% |
| Immigrants | Sudan | 1.1 /100 | #232 | Tragic 18.6% |
| Sudanese | 1.1 /100 | #233 | Tragic 18.6% |
| Fijians | 1.1 /100 | #234 | Tragic 18.6% |
| Nepalese | 1.1 /100 | #235 | Tragic 18.6% |
| Alsatians | 1.1 /100 | #236 | Tragic 18.6% |
| Immigrants | Nigeria | 1.0 /100 | #237 | Tragic 18.6% |
| Immigrants | Eritrea | 1.0 /100 | #238 | Tragic 18.7% |
| Marshallese | 0.9 /100 | #239 | Tragic 18.7% |
| Nigerians | 0.9 /100 | #240 | Tragic 18.7% |
| Americans | 0.8 /100 | #241 | Tragic 18.8% |
| Immigrants | Cuba | 0.7 /100 | #242 | Tragic 18.8% |
| Immigrants | Nicaragua | 0.7 /100 | #243 | Tragic 18.8% |
| Ecuadorians | 0.7 /100 | #244 | Tragic 18.8% |
| Shoshone | 0.6 /100 | #245 | Tragic 18.9% |