Immigrants from Nicaragua vs Macedonian Child Poverty Among Girls Under 16
COMPARE
Immigrants from Nicaragua
Macedonian
Child Poverty Among Girls Under 16
Child Poverty Among Girls Under 16 Comparison
Immigrants from Nicaragua
Macedonians
18.8%
CHILD POVERTY AMONG GIRLS UNDER 16
0.7/ 100
METRIC RATING
243rd/ 347
METRIC RANK
14.7%
CHILD POVERTY AMONG GIRLS UNDER 16
97.6/ 100
METRIC RATING
82nd/ 347
METRIC RANK
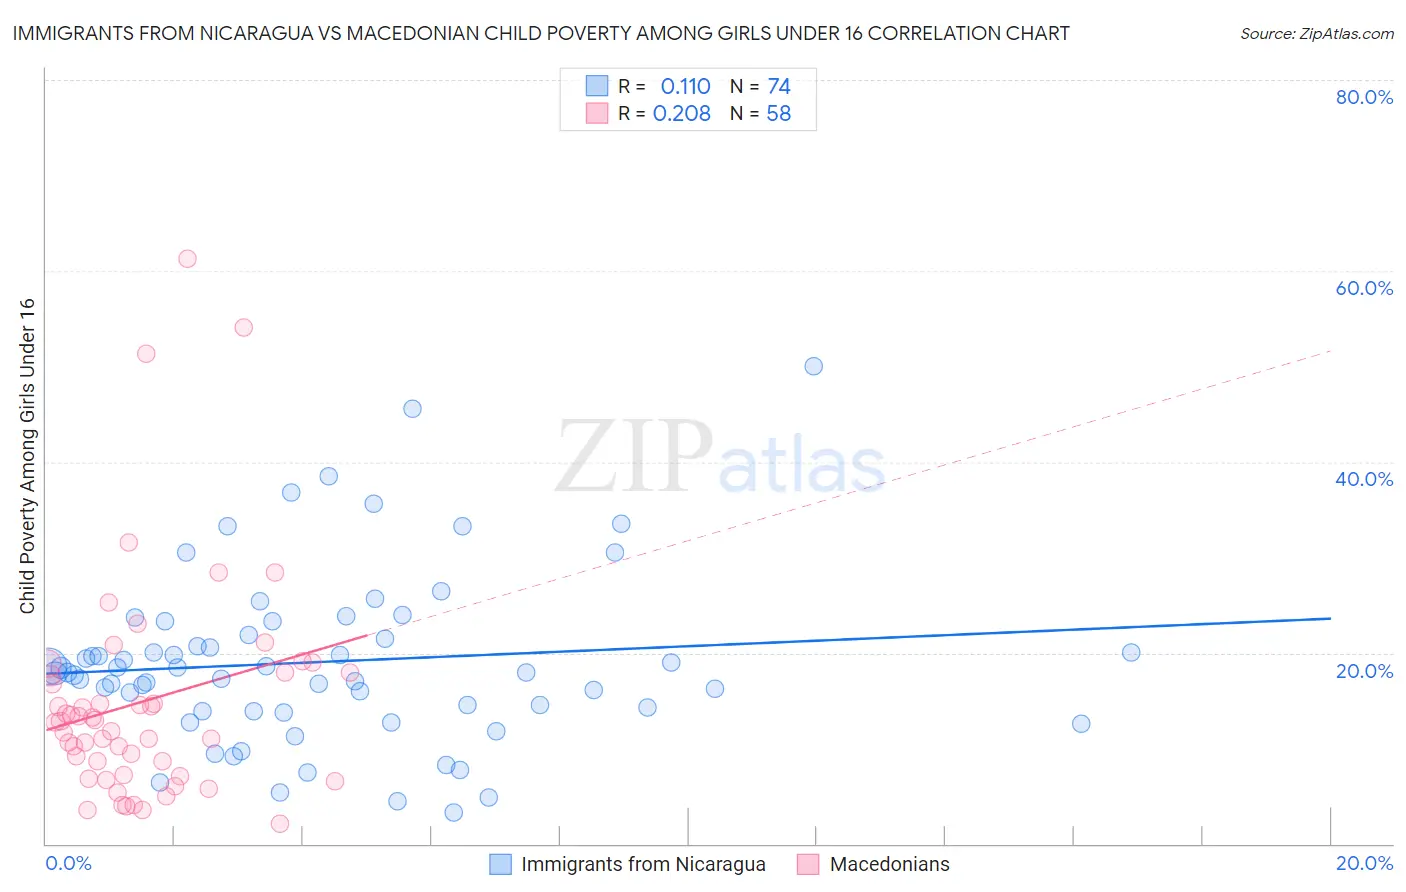
Immigrants from Nicaragua vs Macedonian Child Poverty Among Girls Under 16 Correlation Chart
The statistical analysis conducted on geographies consisting of 234,971,841 people shows a poor positive correlation between the proportion of Immigrants from Nicaragua and poverty level among girls under the age of 16 in the United States with a correlation coefficient (R) of 0.110 and weighted average of 18.8%. Similarly, the statistical analysis conducted on geographies consisting of 131,236,838 people shows a weak positive correlation between the proportion of Macedonians and poverty level among girls under the age of 16 in the United States with a correlation coefficient (R) of 0.208 and weighted average of 14.7%, a difference of 27.9%.
Child Poverty Among Girls Under 16 Correlation Summary
| Measurement | Immigrants from Nicaragua | Macedonian |
| Minimum | 3.3% | 2.1% |
| Maximum | 50.0% | 61.2% |
| Range | 46.7% | 59.1% |
| Mean | 19.1% | 14.9% |
| Median | 18.0% | 12.8% |
| Interquartile 25% (IQ1) | 13.9% | 7.2% |
| Interquartile 75% (IQ3) | 21.9% | 17.9% |
| Interquartile Range (IQR) | 8.0% | 10.7% |
| Standard Deviation (Sample) | 9.0% | 11.7% |
| Standard Deviation (Population) | 8.9% | 11.6% |
Similar Demographics by Child Poverty Among Girls Under 16
Demographics Similar to Immigrants from Nicaragua by Child Poverty Among Girls Under 16
In terms of child poverty among girls under 16, the demographic groups most similar to Immigrants from Nicaragua are Ecuadorian (18.8%, a difference of 0.070%), Shoshone (18.9%, a difference of 0.18%), Immigrants from Laos (18.9%, a difference of 0.21%), Immigrants from Cuba (18.8%, a difference of 0.22%), and American (18.8%, a difference of 0.36%).
| Demographics | Rating | Rank | Child Poverty Among Girls Under 16 |
| Alsatians | 1.1 /100 | #236 | Tragic 18.6% |
| Immigrants | Nigeria | 1.0 /100 | #237 | Tragic 18.6% |
| Immigrants | Eritrea | 1.0 /100 | #238 | Tragic 18.7% |
| Marshallese | 0.9 /100 | #239 | Tragic 18.7% |
| Nigerians | 0.9 /100 | #240 | Tragic 18.7% |
| Americans | 0.8 /100 | #241 | Tragic 18.8% |
| Immigrants | Cuba | 0.7 /100 | #242 | Tragic 18.8% |
| Immigrants | Nicaragua | 0.7 /100 | #243 | Tragic 18.8% |
| Ecuadorians | 0.7 /100 | #244 | Tragic 18.8% |
| Shoshone | 0.6 /100 | #245 | Tragic 18.9% |
| Immigrants | Laos | 0.6 /100 | #246 | Tragic 18.9% |
| Immigrants | Ghana | 0.5 /100 | #247 | Tragic 18.9% |
| French American Indians | 0.3 /100 | #248 | Tragic 19.2% |
| Potawatomi | 0.3 /100 | #249 | Tragic 19.2% |
| Cape Verdeans | 0.3 /100 | #250 | Tragic 19.2% |
Demographics Similar to Macedonians by Child Poverty Among Girls Under 16
In terms of child poverty among girls under 16, the demographic groups most similar to Macedonians are Ukrainian (14.7%, a difference of 0.24%), Immigrants from Italy (14.8%, a difference of 0.25%), Soviet Union (14.8%, a difference of 0.33%), Egyptian (14.7%, a difference of 0.43%), and Immigrants from Turkey (14.7%, a difference of 0.44%).
| Demographics | Rating | Rank | Child Poverty Among Girls Under 16 |
| Immigrants | Eastern Europe | 98.0 /100 | #75 | Exceptional 14.6% |
| Immigrants | Russia | 97.9 /100 | #76 | Exceptional 14.7% |
| Tlingit-Haida | 97.9 /100 | #77 | Exceptional 14.7% |
| Argentineans | 97.9 /100 | #78 | Exceptional 14.7% |
| Immigrants | Turkey | 97.9 /100 | #79 | Exceptional 14.7% |
| Egyptians | 97.9 /100 | #80 | Exceptional 14.7% |
| Ukrainians | 97.7 /100 | #81 | Exceptional 14.7% |
| Macedonians | 97.6 /100 | #82 | Exceptional 14.7% |
| Immigrants | Italy | 97.4 /100 | #83 | Exceptional 14.8% |
| Soviet Union | 97.3 /100 | #84 | Exceptional 14.8% |
| Swiss | 97.2 /100 | #85 | Exceptional 14.8% |
| Australians | 97.2 /100 | #86 | Exceptional 14.8% |
| Finns | 97.2 /100 | #87 | Exceptional 14.8% |
| Immigrants | Canada | 97.1 /100 | #88 | Exceptional 14.8% |
| Jordanians | 97.1 /100 | #89 | Exceptional 14.8% |