German vs Nigerian Single Female Poverty
COMPARE
German
Nigerian
Single Female Poverty
Single Female Poverty Comparison
Germans
Nigerians
21.8%
SINGLE FEMALE POVERTY
8.3/ 100
METRIC RATING
220th/ 347
METRIC RANK
21.4%
SINGLE FEMALE POVERTY
20.9/ 100
METRIC RATING
201st/ 347
METRIC RANK
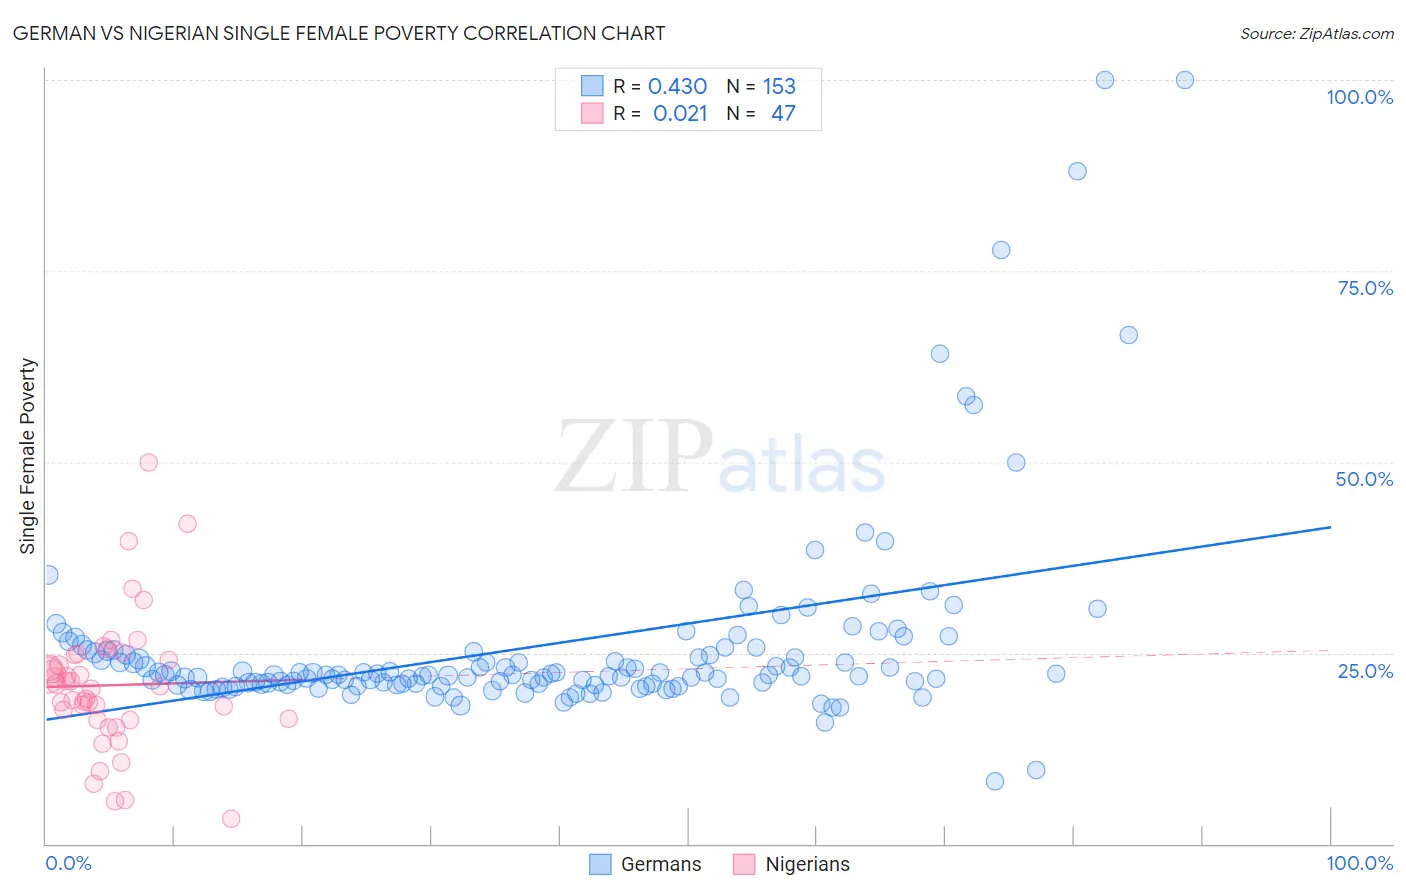
German vs Nigerian Single Female Poverty Correlation Chart
The statistical analysis conducted on geographies consisting of 558,181,228 people shows a moderate positive correlation between the proportion of Germans and poverty level among single females in the United States with a correlation coefficient (R) of 0.430 and weighted average of 21.8%. Similarly, the statistical analysis conducted on geographies consisting of 330,209,143 people shows no correlation between the proportion of Nigerians and poverty level among single females in the United States with a correlation coefficient (R) of 0.021 and weighted average of 21.4%, a difference of 1.6%.
Single Female Poverty Correlation Summary
| Measurement | German | Nigerian |
| Minimum | 8.2% | 3.3% |
| Maximum | 100.0% | 50.0% |
| Range | 91.8% | 46.7% |
| Mean | 26.0% | 20.7% |
| Median | 22.1% | 20.5% |
| Interquartile 25% (IQ1) | 20.8% | 16.2% |
| Interquartile 75% (IQ3) | 25.2% | 24.8% |
| Interquartile Range (IQR) | 4.3% | 8.6% |
| Standard Deviation (Sample) | 13.4% | 8.8% |
| Standard Deviation (Population) | 13.4% | 8.7% |
Demographics Similar to Germans and Nigerians by Single Female Poverty
In terms of single female poverty, the demographic groups most similar to Germans are Panamanian (21.7%, a difference of 0.21%), Nepalese (21.7%, a difference of 0.26%), Immigrants from St. Vincent and the Grenadines (21.7%, a difference of 0.58%), Immigrants from Barbados (21.7%, a difference of 0.65%), and Ecuadorian (21.6%, a difference of 0.67%). Similarly, the demographic groups most similar to Nigerians are Immigrants from Kenya (21.4%, a difference of 0.020%), Irish (21.4%, a difference of 0.040%), Immigrants from Haiti (21.5%, a difference of 0.20%), Immigrants from Africa (21.5%, a difference of 0.42%), and Finnish (21.5%, a difference of 0.48%).
| Demographics | Rating | Rank | Single Female Poverty |
| Irish | 21.4 /100 | #200 | Fair 21.4% |
| Nigerians | 20.9 /100 | #201 | Fair 21.4% |
| Immigrants | Kenya | 20.7 /100 | #202 | Fair 21.4% |
| Immigrants | Haiti | 18.8 /100 | #203 | Poor 21.5% |
| Immigrants | Africa | 16.7 /100 | #204 | Poor 21.5% |
| Finns | 16.2 /100 | #205 | Poor 21.5% |
| Belgians | 16.1 /100 | #206 | Poor 21.5% |
| Ghanaians | 15.7 /100 | #207 | Poor 21.6% |
| Haitians | 15.4 /100 | #208 | Poor 21.6% |
| Immigrants | Eastern Africa | 15.1 /100 | #209 | Poor 21.6% |
| Immigrants | Panama | 14.4 /100 | #210 | Poor 21.6% |
| Icelanders | 14.0 /100 | #211 | Poor 21.6% |
| Jamaicans | 14.0 /100 | #212 | Poor 21.6% |
| Guamanians/Chamorros | 13.7 /100 | #213 | Poor 21.6% |
| Immigrants | Nicaragua | 13.3 /100 | #214 | Poor 21.6% |
| Ecuadorians | 12.3 /100 | #215 | Poor 21.6% |
| Immigrants | Barbados | 12.2 /100 | #216 | Poor 21.7% |
| Immigrants | St. Vincent and the Grenadines | 11.7 /100 | #217 | Poor 21.7% |
| Nepalese | 9.7 /100 | #218 | Tragic 21.7% |
| Panamanians | 9.4 /100 | #219 | Tragic 21.7% |
| Germans | 8.3 /100 | #220 | Tragic 21.8% |