German vs Immigrants from Laos Child Poverty Among Girls Under 16
COMPARE
German
Immigrants from Laos
Child Poverty Among Girls Under 16
Child Poverty Among Girls Under 16 Comparison
Germans
Immigrants from Laos
14.9%
CHILD POVERTY AMONG GIRLS UNDER 16
96.3/ 100
METRIC RATING
95th/ 347
METRIC RANK
18.9%
CHILD POVERTY AMONG GIRLS UNDER 16
0.6/ 100
METRIC RATING
246th/ 347
METRIC RANK
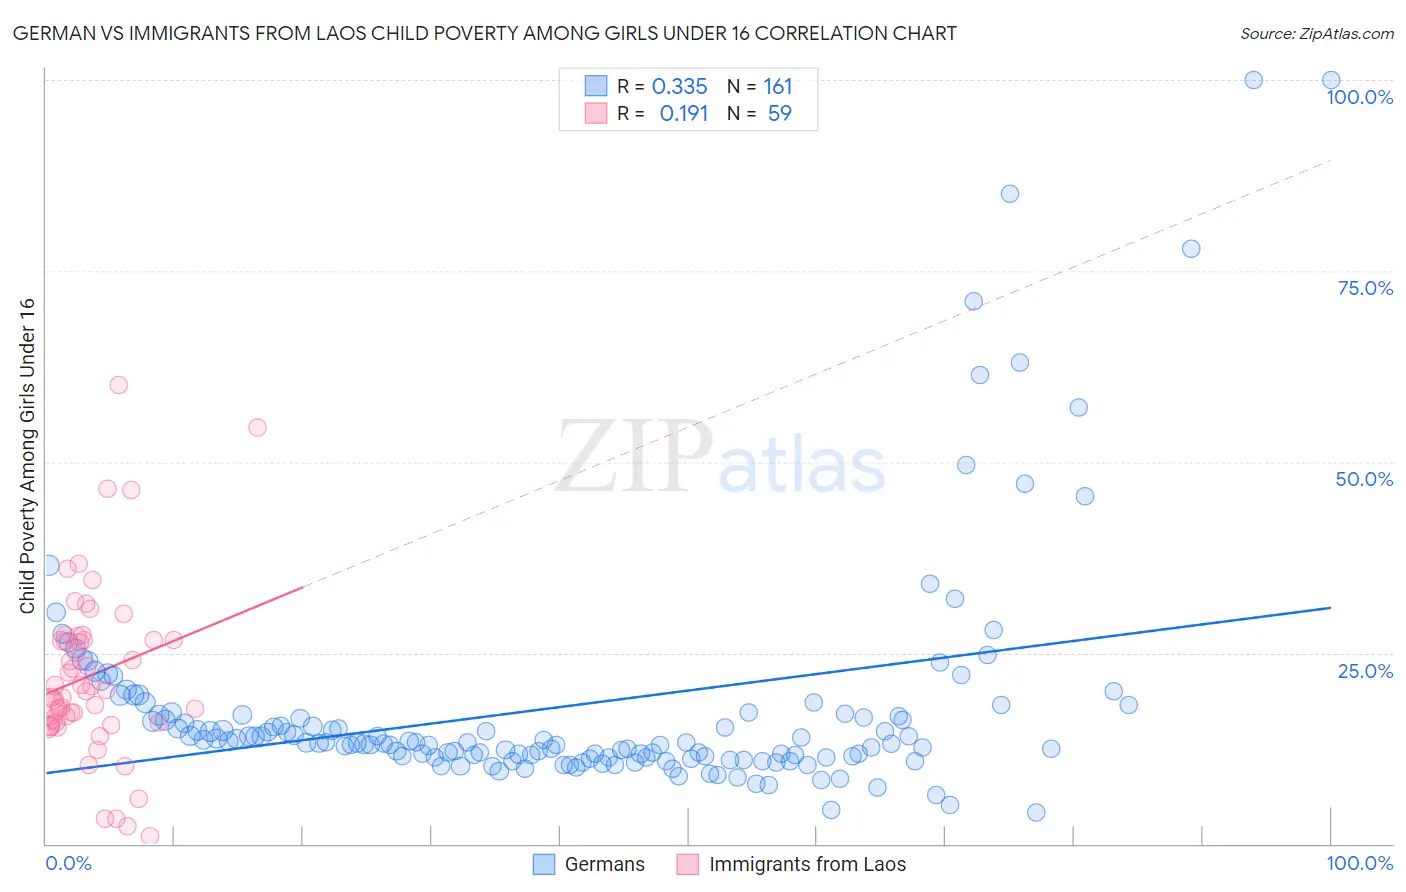
German vs Immigrants from Laos Child Poverty Among Girls Under 16 Correlation Chart
The statistical analysis conducted on geographies consisting of 555,937,968 people shows a mild positive correlation between the proportion of Germans and poverty level among girls under the age of 16 in the United States with a correlation coefficient (R) of 0.335 and weighted average of 14.9%. Similarly, the statistical analysis conducted on geographies consisting of 199,827,188 people shows a poor positive correlation between the proportion of Immigrants from Laos and poverty level among girls under the age of 16 in the United States with a correlation coefficient (R) of 0.191 and weighted average of 18.9%, a difference of 26.4%.
Child Poverty Among Girls Under 16 Correlation Summary
| Measurement | German | Immigrants from Laos |
| Minimum | 4.2% | 1.0% |
| Maximum | 100.0% | 60.0% |
| Range | 95.8% | 59.0% |
| Mean | 18.0% | 22.2% |
| Median | 13.3% | 20.1% |
| Interquartile 25% (IQ1) | 11.4% | 15.9% |
| Interquartile 75% (IQ3) | 17.0% | 26.8% |
| Interquartile Range (IQR) | 5.6% | 10.9% |
| Standard Deviation (Sample) | 15.6% | 11.4% |
| Standard Deviation (Population) | 15.5% | 11.3% |
Similar Demographics by Child Poverty Among Girls Under 16
Demographics Similar to Germans by Child Poverty Among Girls Under 16
In terms of child poverty among girls under 16, the demographic groups most similar to Germans are Immigrants from Switzerland (14.9%, a difference of 0.020%), Immigrants from France (14.9%, a difference of 0.040%), Immigrants from Latvia (14.9%, a difference of 0.13%), Immigrants from North America (14.9%, a difference of 0.30%), and Basque (15.0%, a difference of 0.32%).
| Demographics | Rating | Rank | Child Poverty Among Girls Under 16 |
| Immigrants | Canada | 97.1 /100 | #88 | Exceptional 14.8% |
| Jordanians | 97.1 /100 | #89 | Exceptional 14.8% |
| Northern Europeans | 97.0 /100 | #90 | Exceptional 14.8% |
| Immigrants | Belarus | 97.0 /100 | #91 | Exceptional 14.8% |
| Austrians | 96.7 /100 | #92 | Exceptional 14.9% |
| Immigrants | North America | 96.6 /100 | #93 | Exceptional 14.9% |
| Immigrants | Switzerland | 96.3 /100 | #94 | Exceptional 14.9% |
| Germans | 96.3 /100 | #95 | Exceptional 14.9% |
| Immigrants | France | 96.2 /100 | #96 | Exceptional 14.9% |
| Immigrants | Latvia | 96.1 /100 | #97 | Exceptional 14.9% |
| Basques | 95.9 /100 | #98 | Exceptional 15.0% |
| Immigrants | Egypt | 95.7 /100 | #99 | Exceptional 15.0% |
| Paraguayans | 95.7 /100 | #100 | Exceptional 15.0% |
| Immigrants | South Africa | 95.6 /100 | #101 | Exceptional 15.0% |
| Immigrants | Malaysia | 95.6 /100 | #102 | Exceptional 15.0% |
Demographics Similar to Immigrants from Laos by Child Poverty Among Girls Under 16
In terms of child poverty among girls under 16, the demographic groups most similar to Immigrants from Laos are Shoshone (18.9%, a difference of 0.030%), Ecuadorian (18.8%, a difference of 0.14%), Immigrants from Nicaragua (18.8%, a difference of 0.21%), Immigrants from Ghana (18.9%, a difference of 0.37%), and Immigrants from Cuba (18.8%, a difference of 0.43%).
| Demographics | Rating | Rank | Child Poverty Among Girls Under 16 |
| Marshallese | 0.9 /100 | #239 | Tragic 18.7% |
| Nigerians | 0.9 /100 | #240 | Tragic 18.7% |
| Americans | 0.8 /100 | #241 | Tragic 18.8% |
| Immigrants | Cuba | 0.7 /100 | #242 | Tragic 18.8% |
| Immigrants | Nicaragua | 0.7 /100 | #243 | Tragic 18.8% |
| Ecuadorians | 0.7 /100 | #244 | Tragic 18.8% |
| Shoshone | 0.6 /100 | #245 | Tragic 18.9% |
| Immigrants | Laos | 0.6 /100 | #246 | Tragic 18.9% |
| Immigrants | Ghana | 0.5 /100 | #247 | Tragic 18.9% |
| French American Indians | 0.3 /100 | #248 | Tragic 19.2% |
| Potawatomi | 0.3 /100 | #249 | Tragic 19.2% |
| Cape Verdeans | 0.3 /100 | #250 | Tragic 19.2% |
| Immigrants | Trinidad and Tobago | 0.3 /100 | #251 | Tragic 19.2% |
| Immigrants | Middle Africa | 0.3 /100 | #252 | Tragic 19.2% |
| Immigrants | Guyana | 0.3 /100 | #253 | Tragic 19.3% |