Uruguayan vs Immigrants from the Azores Female Poverty
COMPARE
Uruguayan
Immigrants from the Azores
Female Poverty
Female Poverty Comparison
Uruguayans
Immigrants from the Azores
13.6%
FEMALE POVERTY
39.8/ 100
METRIC RATING
189th/ 347
METRIC RANK
14.2%
FEMALE POVERTY
7.9/ 100
METRIC RATING
208th/ 347
METRIC RANK
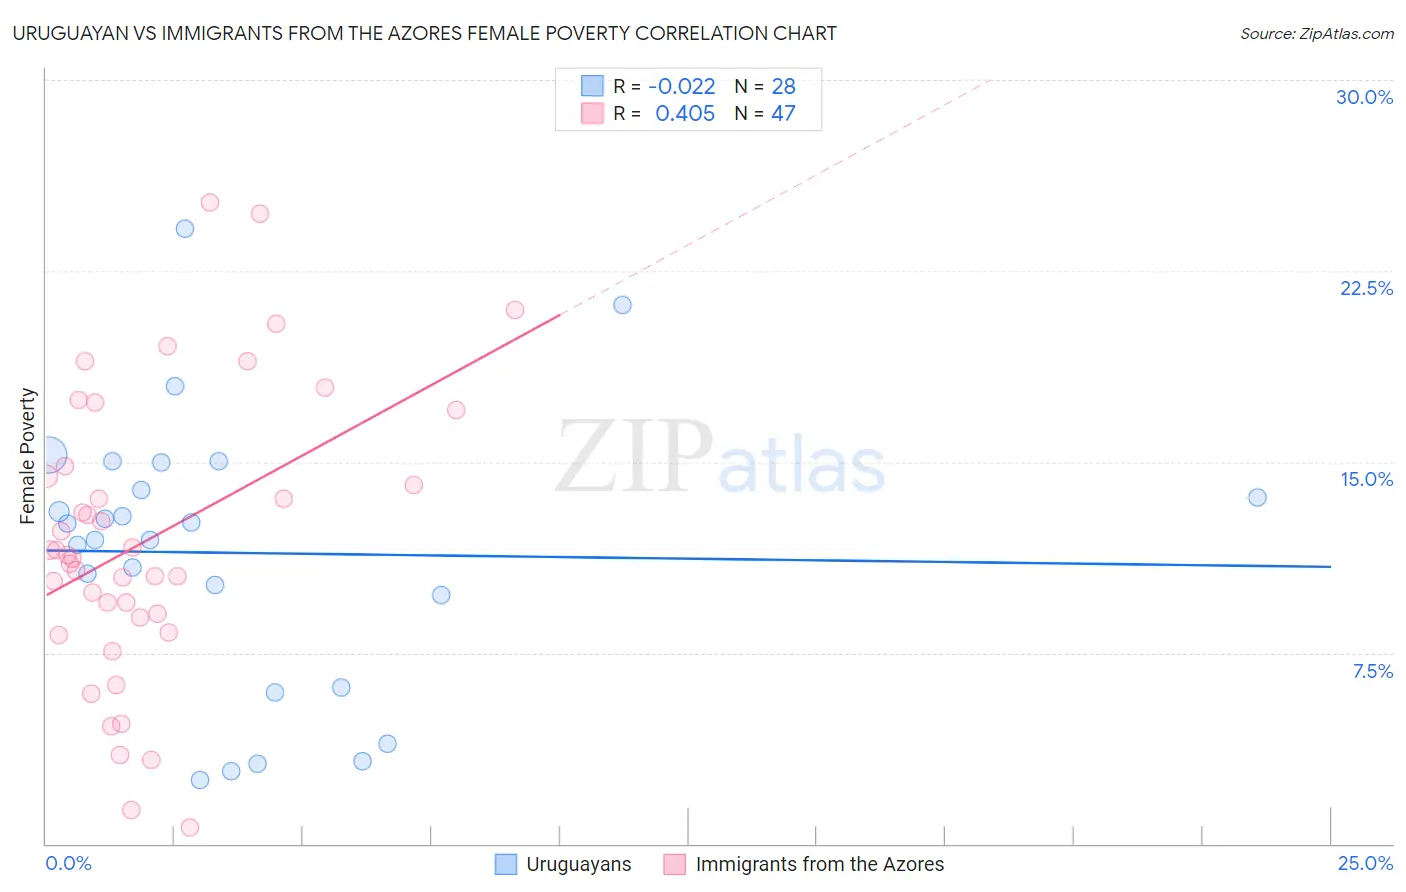
Uruguayan vs Immigrants from the Azores Female Poverty Correlation Chart
The statistical analysis conducted on geographies consisting of 144,759,999 people shows no correlation between the proportion of Uruguayans and poverty level among females in the United States with a correlation coefficient (R) of -0.022 and weighted average of 13.6%. Similarly, the statistical analysis conducted on geographies consisting of 46,244,959 people shows a moderate positive correlation between the proportion of Immigrants from the Azores and poverty level among females in the United States with a correlation coefficient (R) of 0.405 and weighted average of 14.2%, a difference of 4.9%.
Female Poverty Correlation Summary
| Measurement | Uruguayan | Immigrants from the Azores |
| Minimum | 2.5% | 0.65% |
| Maximum | 24.1% | 25.2% |
| Range | 21.6% | 24.5% |
| Mean | 11.4% | 12.0% |
| Median | 12.3% | 11.3% |
| Interquartile 25% (IQ1) | 8.0% | 8.9% |
| Interquartile 75% (IQ3) | 14.4% | 14.8% |
| Interquartile Range (IQR) | 6.5% | 5.9% |
| Standard Deviation (Sample) | 5.4% | 5.6% |
| Standard Deviation (Population) | 5.3% | 5.6% |
Demographics Similar to Uruguayans and Immigrants from the Azores by Female Poverty
In terms of female poverty, the demographic groups most similar to Uruguayans are Hawaiian (13.6%, a difference of 0.010%), Sierra Leonean (13.7%, a difference of 0.69%), Immigrants from Kuwait (13.7%, a difference of 0.73%), Immigrants from Costa Rica (13.7%, a difference of 0.82%), and Iraqi (13.7%, a difference of 0.84%). Similarly, the demographic groups most similar to Immigrants from the Azores are Immigrants from Eastern Africa (14.2%, a difference of 0.34%), Immigrants from Uruguay (14.0%, a difference of 1.5%), Ugandan (14.0%, a difference of 1.8%), Spaniard (13.9%, a difference of 2.3%), and Immigrants from Western Asia (13.9%, a difference of 2.6%).
| Demographics | Rating | Rank | Female Poverty |
| Hawaiians | 39.9 /100 | #188 | Fair 13.6% |
| Uruguayans | 39.8 /100 | #189 | Fair 13.6% |
| Sierra Leoneans | 33.1 /100 | #190 | Fair 13.7% |
| Immigrants | Kuwait | 32.7 /100 | #191 | Fair 13.7% |
| Immigrants | Costa Rica | 31.9 /100 | #192 | Fair 13.7% |
| Iraqis | 31.8 /100 | #193 | Fair 13.7% |
| Delaware | 31.1 /100 | #194 | Fair 13.7% |
| Immigrants | South America | 30.6 /100 | #195 | Fair 13.7% |
| South American Indians | 28.9 /100 | #196 | Fair 13.7% |
| Arabs | 28.6 /100 | #197 | Fair 13.7% |
| Immigrants | Uganda | 28.5 /100 | #198 | Fair 13.7% |
| Immigrants | Lebanon | 25.6 /100 | #199 | Fair 13.8% |
| Spanish | 21.4 /100 | #200 | Fair 13.9% |
| Immigrants | Kenya | 21.1 /100 | #201 | Fair 13.9% |
| Hmong | 21.1 /100 | #202 | Fair 13.9% |
| Immigrants | Western Asia | 20.7 /100 | #203 | Fair 13.9% |
| Spaniards | 18.9 /100 | #204 | Poor 13.9% |
| Ugandans | 15.4 /100 | #205 | Poor 14.0% |
| Immigrants | Uruguay | 14.0 /100 | #206 | Poor 14.0% |
| Immigrants | Eastern Africa | 9.0 /100 | #207 | Tragic 14.2% |
| Immigrants | Azores | 7.9 /100 | #208 | Tragic 14.2% |