German Russian vs Immigrants from the Azores Disability Age Over 75
COMPARE
German Russian
Immigrants from the Azores
Disability Age Over 75
Disability Age Over 75 Comparison
German Russians
Immigrants from the Azores
47.3%
DISABILITY AGE OVER 75
56.2/ 100
METRIC RATING
170th/ 347
METRIC RANK
50.9%
DISABILITY AGE OVER 75
0.0/ 100
METRIC RATING
313th/ 347
METRIC RANK
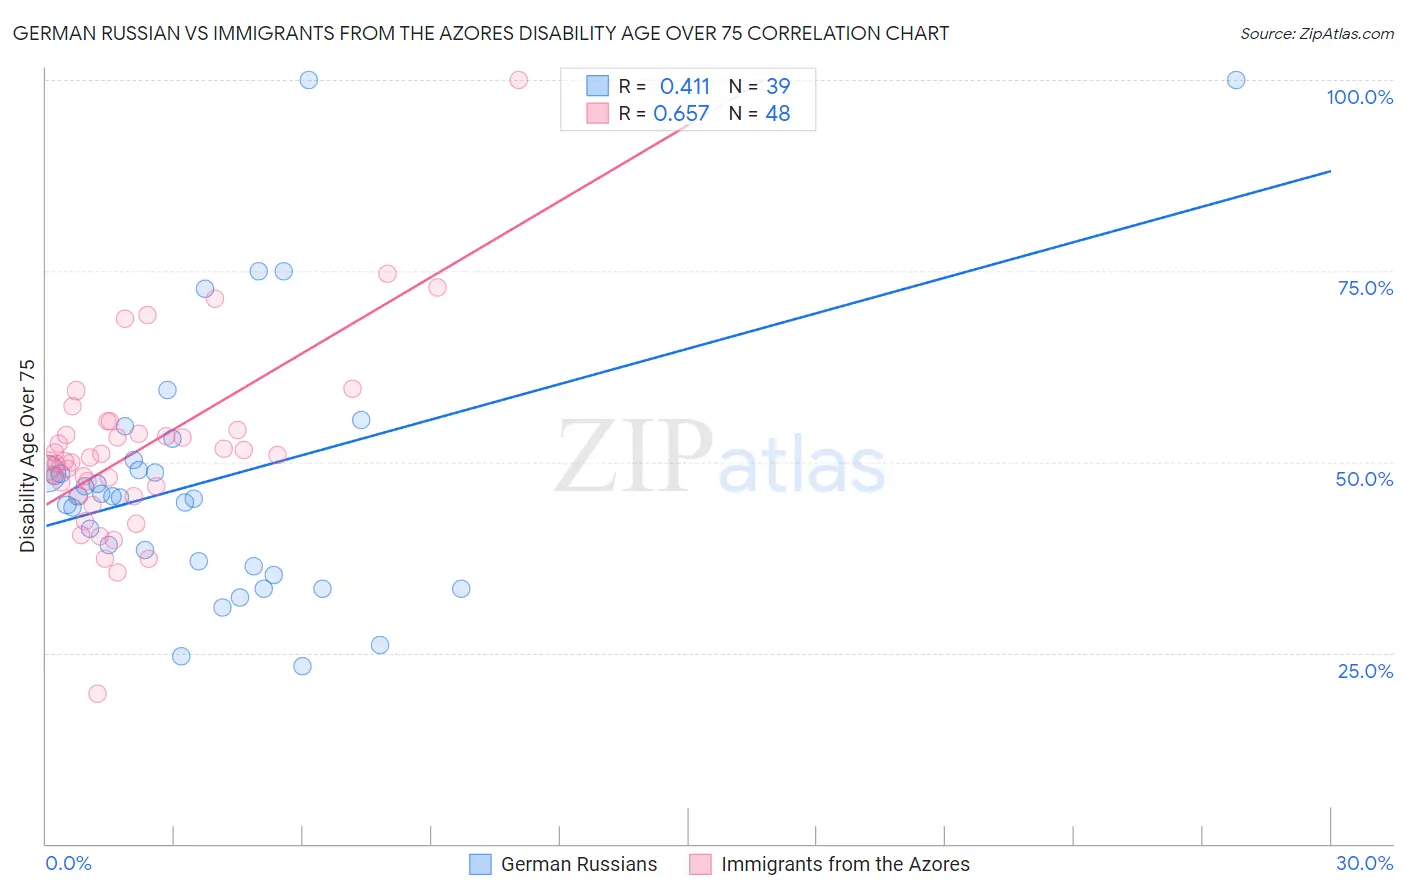
German Russian vs Immigrants from the Azores Disability Age Over 75 Correlation Chart
The statistical analysis conducted on geographies consisting of 96,358,240 people shows a moderate positive correlation between the proportion of German Russians and percentage of population with a disability over the age of 75 in the United States with a correlation coefficient (R) of 0.411 and weighted average of 47.3%. Similarly, the statistical analysis conducted on geographies consisting of 46,256,108 people shows a significant positive correlation between the proportion of Immigrants from the Azores and percentage of population with a disability over the age of 75 in the United States with a correlation coefficient (R) of 0.657 and weighted average of 50.9%, a difference of 7.7%.
Disability Age Over 75 Correlation Summary
| Measurement | German Russian | Immigrants from the Azores |
| Minimum | 23.2% | 19.7% |
| Maximum | 100.0% | 100.0% |
| Range | 76.8% | 80.3% |
| Mean | 47.6% | 51.6% |
| Median | 45.4% | 50.4% |
| Interquartile 25% (IQ1) | 36.4% | 46.3% |
| Interquartile 75% (IQ3) | 50.2% | 53.9% |
| Interquartile Range (IQR) | 13.8% | 7.6% |
| Standard Deviation (Sample) | 17.2% | 12.2% |
| Standard Deviation (Population) | 17.0% | 12.1% |
Similar Demographics by Disability Age Over 75
Demographics Similar to German Russians by Disability Age Over 75
In terms of disability age over 75, the demographic groups most similar to German Russians are Kenyan (47.2%, a difference of 0.060%), Celtic (47.2%, a difference of 0.060%), Immigrants from Africa (47.3%, a difference of 0.060%), Scotch-Irish (47.3%, a difference of 0.080%), and Alsatian (47.3%, a difference of 0.10%).
| Demographics | Rating | Rank | Disability Age Over 75 |
| Immigrants | Eastern Africa | 65.5 /100 | #163 | Good 47.2% |
| French | 64.6 /100 | #164 | Good 47.2% |
| Immigrants | Zimbabwe | 64.4 /100 | #165 | Good 47.2% |
| Immigrants | Sierra Leone | 64.4 /100 | #166 | Good 47.2% |
| Moroccans | 62.9 /100 | #167 | Good 47.2% |
| Kenyans | 58.8 /100 | #168 | Average 47.2% |
| Celtics | 58.7 /100 | #169 | Average 47.2% |
| German Russians | 56.2 /100 | #170 | Average 47.3% |
| Immigrants | Africa | 53.6 /100 | #171 | Average 47.3% |
| Scotch-Irish | 52.5 /100 | #172 | Average 47.3% |
| Alsatians | 51.9 /100 | #173 | Average 47.3% |
| Whites/Caucasians | 50.0 /100 | #174 | Average 47.3% |
| Immigrants | Haiti | 49.7 /100 | #175 | Average 47.3% |
| Ecuadorians | 46.7 /100 | #176 | Average 47.4% |
| Haitians | 44.6 /100 | #177 | Average 47.4% |
Demographics Similar to Immigrants from the Azores by Disability Age Over 75
In terms of disability age over 75, the demographic groups most similar to Immigrants from the Azores are Cheyenne (50.9%, a difference of 0.050%), Immigrants from Mexico (51.1%, a difference of 0.37%), Mexican (51.1%, a difference of 0.42%), Cajun (50.7%, a difference of 0.50%), and Chickasaw (51.2%, a difference of 0.56%).
| Demographics | Rating | Rank | Disability Age Over 75 |
| Immigrants | Central America | 0.0 /100 | #306 | Tragic 50.5% |
| Immigrants | Fiji | 0.0 /100 | #307 | Tragic 50.6% |
| Hispanics or Latinos | 0.0 /100 | #308 | Tragic 50.6% |
| Aleuts | 0.0 /100 | #309 | Tragic 50.6% |
| Tlingit-Haida | 0.0 /100 | #310 | Tragic 50.6% |
| Cajuns | 0.0 /100 | #311 | Tragic 50.7% |
| Cheyenne | 0.0 /100 | #312 | Tragic 50.9% |
| Immigrants | Azores | 0.0 /100 | #313 | Tragic 50.9% |
| Immigrants | Mexico | 0.0 /100 | #314 | Tragic 51.1% |
| Mexicans | 0.0 /100 | #315 | Tragic 51.1% |
| Chickasaw | 0.0 /100 | #316 | Tragic 51.2% |
| Yakama | 0.0 /100 | #317 | Tragic 51.3% |
| Seminole | 0.0 /100 | #318 | Tragic 51.5% |
| Creek | 0.0 /100 | #319 | Tragic 51.5% |
| Paiute | 0.0 /100 | #320 | Tragic 51.5% |