German Russian vs Costa Rican Child Poverty Among Girls Under 16
COMPARE
German Russian
Costa Rican
Child Poverty Among Girls Under 16
Child Poverty Among Girls Under 16 Comparison
German Russians
Costa Ricans
17.8%
CHILD POVERTY AMONG GIRLS UNDER 16
5.7/ 100
METRIC RATING
215th/ 347
METRIC RANK
16.2%
CHILD POVERTY AMONG GIRLS UNDER 16
64.2/ 100
METRIC RATING
169th/ 347
METRIC RANK
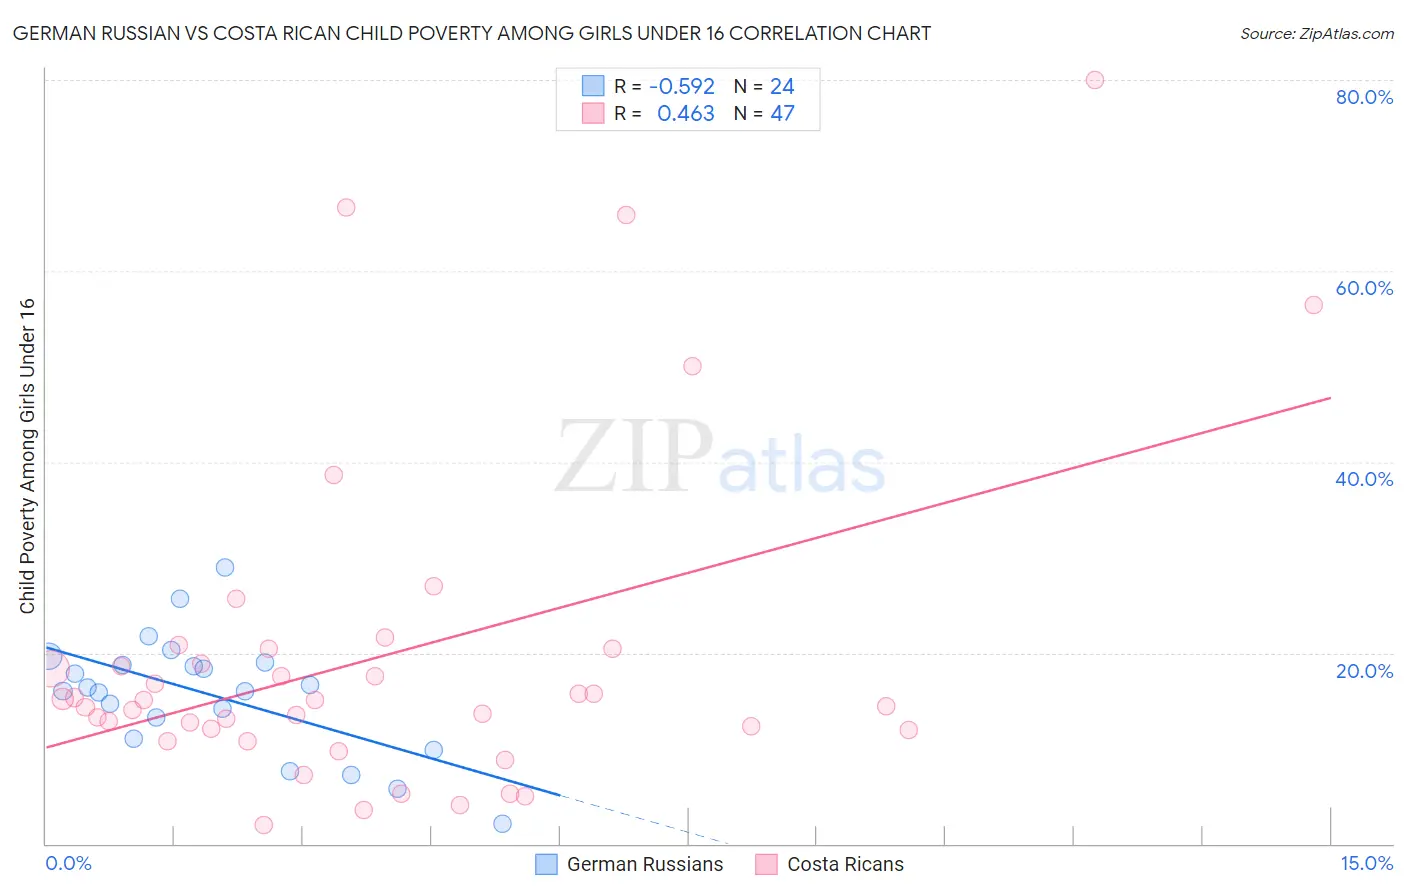
German Russian vs Costa Rican Child Poverty Among Girls Under 16 Correlation Chart
The statistical analysis conducted on geographies consisting of 96,035,959 people shows a substantial negative correlation between the proportion of German Russians and poverty level among girls under the age of 16 in the United States with a correlation coefficient (R) of -0.592 and weighted average of 17.8%. Similarly, the statistical analysis conducted on geographies consisting of 251,202,107 people shows a moderate positive correlation between the proportion of Costa Ricans and poverty level among girls under the age of 16 in the United States with a correlation coefficient (R) of 0.463 and weighted average of 16.2%, a difference of 9.9%.
Child Poverty Among Girls Under 16 Correlation Summary
| Measurement | German Russian | Costa Rican |
| Minimum | 2.2% | 2.0% |
| Maximum | 28.9% | 80.0% |
| Range | 26.8% | 78.0% |
| Mean | 15.6% | 19.6% |
| Median | 16.2% | 15.0% |
| Interquartile 25% (IQ1) | 12.1% | 11.9% |
| Interquartile 75% (IQ3) | 18.9% | 20.4% |
| Interquartile Range (IQR) | 6.8% | 8.5% |
| Standard Deviation (Sample) | 6.2% | 17.0% |
| Standard Deviation (Population) | 6.0% | 16.8% |
Similar Demographics by Child Poverty Among Girls Under 16
Demographics Similar to German Russians by Child Poverty Among Girls Under 16
In terms of child poverty among girls under 16, the demographic groups most similar to German Russians are Malaysian (17.8%, a difference of 0.0%), Pennsylvania German (17.8%, a difference of 0.020%), Moroccan (17.8%, a difference of 0.10%), Japanese (17.8%, a difference of 0.19%), and Immigrants from Thailand (17.7%, a difference of 0.28%).
| Demographics | Rating | Rank | Child Poverty Among Girls Under 16 |
| Sierra Leoneans | 8.9 /100 | #208 | Tragic 17.6% |
| Panamanians | 8.7 /100 | #209 | Tragic 17.6% |
| Immigrants | Immigrants | 7.3 /100 | #210 | Tragic 17.7% |
| Immigrants | Eastern Africa | 6.4 /100 | #211 | Tragic 17.7% |
| Immigrants | Thailand | 6.3 /100 | #212 | Tragic 17.7% |
| Pennsylvania Germans | 5.7 /100 | #213 | Tragic 17.8% |
| Malaysians | 5.7 /100 | #214 | Tragic 17.8% |
| German Russians | 5.7 /100 | #215 | Tragic 17.8% |
| Moroccans | 5.5 /100 | #216 | Tragic 17.8% |
| Japanese | 5.3 /100 | #217 | Tragic 17.8% |
| Alaska Natives | 5.2 /100 | #218 | Tragic 17.8% |
| Immigrants | Panama | 4.7 /100 | #219 | Tragic 17.9% |
| Cubans | 4.1 /100 | #220 | Tragic 18.0% |
| Immigrants | Micronesia | 3.5 /100 | #221 | Tragic 18.0% |
| Immigrants | Cambodia | 2.9 /100 | #222 | Tragic 18.1% |
Demographics Similar to Costa Ricans by Child Poverty Among Girls Under 16
In terms of child poverty among girls under 16, the demographic groups most similar to Costa Ricans are Immigrants from Venezuela (16.2%, a difference of 0.0%), Yugoslavian (16.2%, a difference of 0.010%), Immigrants from Saudi Arabia (16.2%, a difference of 0.030%), Uruguayan (16.2%, a difference of 0.060%), and Afghan (16.2%, a difference of 0.24%).
| Demographics | Rating | Rank | Child Poverty Among Girls Under 16 |
| French Canadians | 68.7 /100 | #162 | Good 16.1% |
| Immigrants | Oceania | 68.4 /100 | #163 | Good 16.1% |
| Immigrants | Colombia | 67.8 /100 | #164 | Good 16.1% |
| Immigrants | Germany | 67.3 /100 | #165 | Good 16.1% |
| South Americans | 67.2 /100 | #166 | Good 16.1% |
| Uruguayans | 64.7 /100 | #167 | Good 16.2% |
| Yugoslavians | 64.4 /100 | #168 | Good 16.2% |
| Costa Ricans | 64.2 /100 | #169 | Good 16.2% |
| Immigrants | Venezuela | 64.2 /100 | #170 | Good 16.2% |
| Immigrants | Saudi Arabia | 64.0 /100 | #171 | Good 16.2% |
| Afghans | 62.3 /100 | #172 | Good 16.2% |
| Immigrants | South America | 55.1 /100 | #173 | Average 16.4% |
| Ethiopians | 50.0 /100 | #174 | Average 16.5% |
| Lebanese | 45.4 /100 | #175 | Average 16.6% |
| Hungarians | 45.1 /100 | #176 | Average 16.6% |