German Russian vs Inupiat Child Poverty Among Girls Under 16
COMPARE
German Russian
Inupiat
Child Poverty Among Girls Under 16
Child Poverty Among Girls Under 16 Comparison
German Russians
Inupiat
17.8%
CHILD POVERTY AMONG GIRLS UNDER 16
5.7/ 100
METRIC RATING
215th/ 347
METRIC RANK
20.8%
CHILD POVERTY AMONG GIRLS UNDER 16
0.0/ 100
METRIC RATING
297th/ 347
METRIC RANK
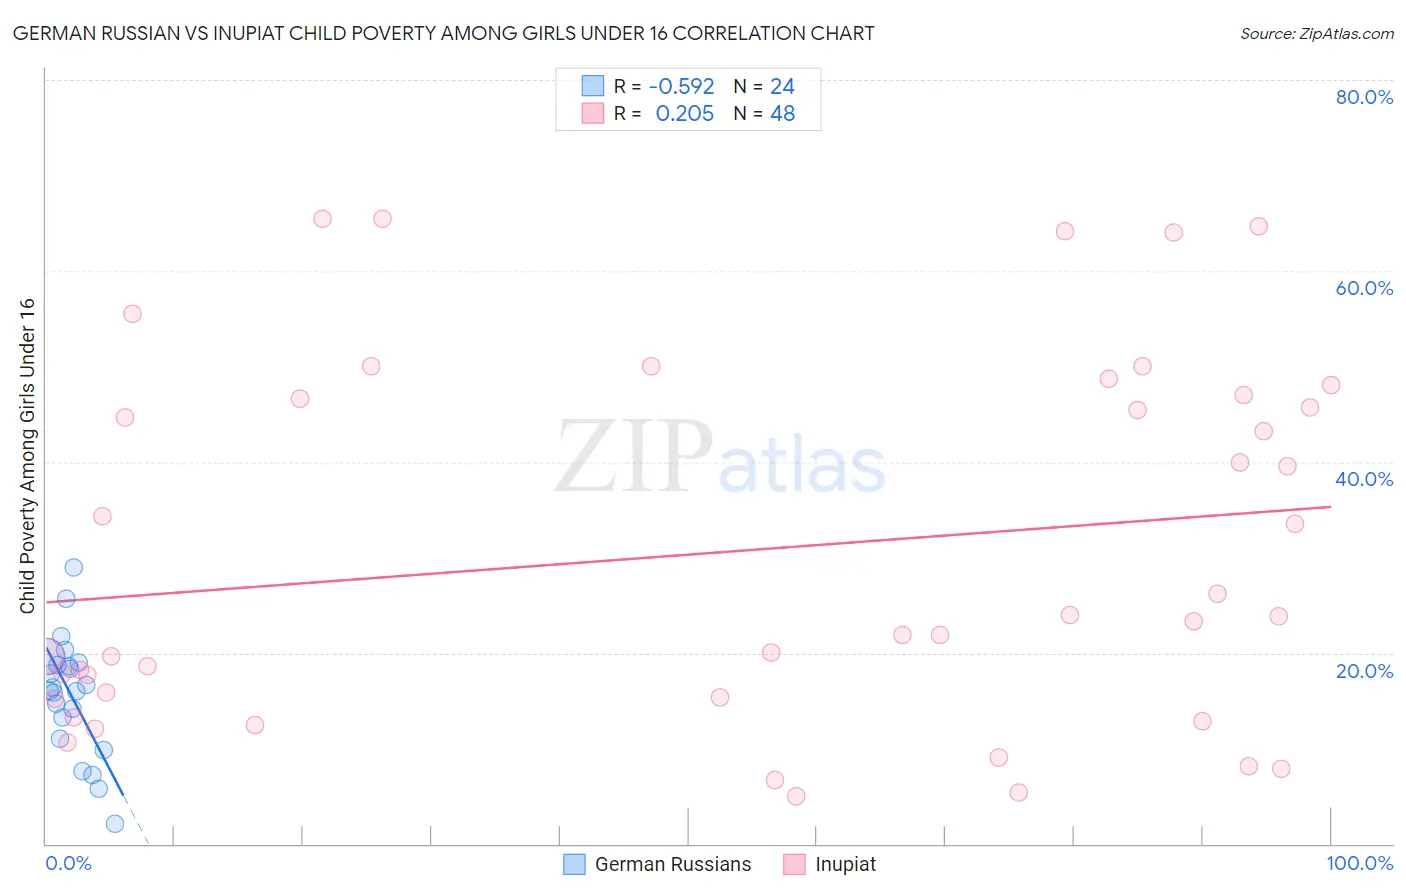
German Russian vs Inupiat Child Poverty Among Girls Under 16 Correlation Chart
The statistical analysis conducted on geographies consisting of 96,035,959 people shows a substantial negative correlation between the proportion of German Russians and poverty level among girls under the age of 16 in the United States with a correlation coefficient (R) of -0.592 and weighted average of 17.8%. Similarly, the statistical analysis conducted on geographies consisting of 95,999,141 people shows a weak positive correlation between the proportion of Inupiat and poverty level among girls under the age of 16 in the United States with a correlation coefficient (R) of 0.205 and weighted average of 20.8%, a difference of 16.7%.
Child Poverty Among Girls Under 16 Correlation Summary
| Measurement | German Russian | Inupiat |
| Minimum | 2.2% | 5.0% |
| Maximum | 28.9% | 65.5% |
| Range | 26.8% | 60.5% |
| Mean | 15.6% | 30.6% |
| Median | 16.2% | 23.6% |
| Interquartile 25% (IQ1) | 12.1% | 15.2% |
| Interquartile 75% (IQ3) | 18.9% | 46.8% |
| Interquartile Range (IQR) | 6.8% | 31.6% |
| Standard Deviation (Sample) | 6.2% | 18.9% |
| Standard Deviation (Population) | 6.0% | 18.7% |
Similar Demographics by Child Poverty Among Girls Under 16
Demographics Similar to German Russians by Child Poverty Among Girls Under 16
In terms of child poverty among girls under 16, the demographic groups most similar to German Russians are Malaysian (17.8%, a difference of 0.0%), Pennsylvania German (17.8%, a difference of 0.020%), Moroccan (17.8%, a difference of 0.10%), Japanese (17.8%, a difference of 0.19%), and Immigrants from Thailand (17.7%, a difference of 0.28%).
| Demographics | Rating | Rank | Child Poverty Among Girls Under 16 |
| Sierra Leoneans | 8.9 /100 | #208 | Tragic 17.6% |
| Panamanians | 8.7 /100 | #209 | Tragic 17.6% |
| Immigrants | Immigrants | 7.3 /100 | #210 | Tragic 17.7% |
| Immigrants | Eastern Africa | 6.4 /100 | #211 | Tragic 17.7% |
| Immigrants | Thailand | 6.3 /100 | #212 | Tragic 17.7% |
| Pennsylvania Germans | 5.7 /100 | #213 | Tragic 17.8% |
| Malaysians | 5.7 /100 | #214 | Tragic 17.8% |
| German Russians | 5.7 /100 | #215 | Tragic 17.8% |
| Moroccans | 5.5 /100 | #216 | Tragic 17.8% |
| Japanese | 5.3 /100 | #217 | Tragic 17.8% |
| Alaska Natives | 5.2 /100 | #218 | Tragic 17.8% |
| Immigrants | Panama | 4.7 /100 | #219 | Tragic 17.9% |
| Cubans | 4.1 /100 | #220 | Tragic 18.0% |
| Immigrants | Micronesia | 3.5 /100 | #221 | Tragic 18.0% |
| Immigrants | Cambodia | 2.9 /100 | #222 | Tragic 18.1% |
Demographics Similar to Inupiat by Child Poverty Among Girls Under 16
In terms of child poverty among girls under 16, the demographic groups most similar to Inupiat are Immigrants from West Indies (20.7%, a difference of 0.070%), Immigrants from Caribbean (20.7%, a difference of 0.34%), Immigrants from Senegal (20.7%, a difference of 0.38%), Immigrants from Grenada (20.7%, a difference of 0.49%), and Mexican (20.9%, a difference of 0.52%).
| Demographics | Rating | Rank | Child Poverty Among Girls Under 16 |
| Immigrants | Haiti | 0.0 /100 | #290 | Tragic 20.6% |
| Chippewa | 0.0 /100 | #291 | Tragic 20.6% |
| Immigrants | Latin America | 0.0 /100 | #292 | Tragic 20.6% |
| Immigrants | Grenada | 0.0 /100 | #293 | Tragic 20.7% |
| Immigrants | Senegal | 0.0 /100 | #294 | Tragic 20.7% |
| Immigrants | Caribbean | 0.0 /100 | #295 | Tragic 20.7% |
| Immigrants | West Indies | 0.0 /100 | #296 | Tragic 20.7% |
| Inupiat | 0.0 /100 | #297 | Tragic 20.8% |
| Mexicans | 0.0 /100 | #298 | Tragic 20.9% |
| Hispanics or Latinos | 0.0 /100 | #299 | Tragic 21.0% |
| Somalis | 0.0 /100 | #300 | Tragic 21.0% |
| Choctaw | 0.0 /100 | #301 | Tragic 21.1% |
| Seminole | 0.0 /100 | #302 | Tragic 21.2% |
| British West Indians | 0.0 /100 | #303 | Tragic 21.3% |
| Indonesians | 0.0 /100 | #304 | Tragic 21.3% |