German Russian vs Immigrants from Guatemala Child Poverty Among Girls Under 16
COMPARE
German Russian
Immigrants from Guatemala
Child Poverty Among Girls Under 16
Child Poverty Among Girls Under 16 Comparison
German Russians
Immigrants from Guatemala
17.8%
CHILD POVERTY AMONG GIRLS UNDER 16
5.7/ 100
METRIC RATING
215th/ 347
METRIC RANK
21.9%
CHILD POVERTY AMONG GIRLS UNDER 16
0.0/ 100
METRIC RATING
316th/ 347
METRIC RANK
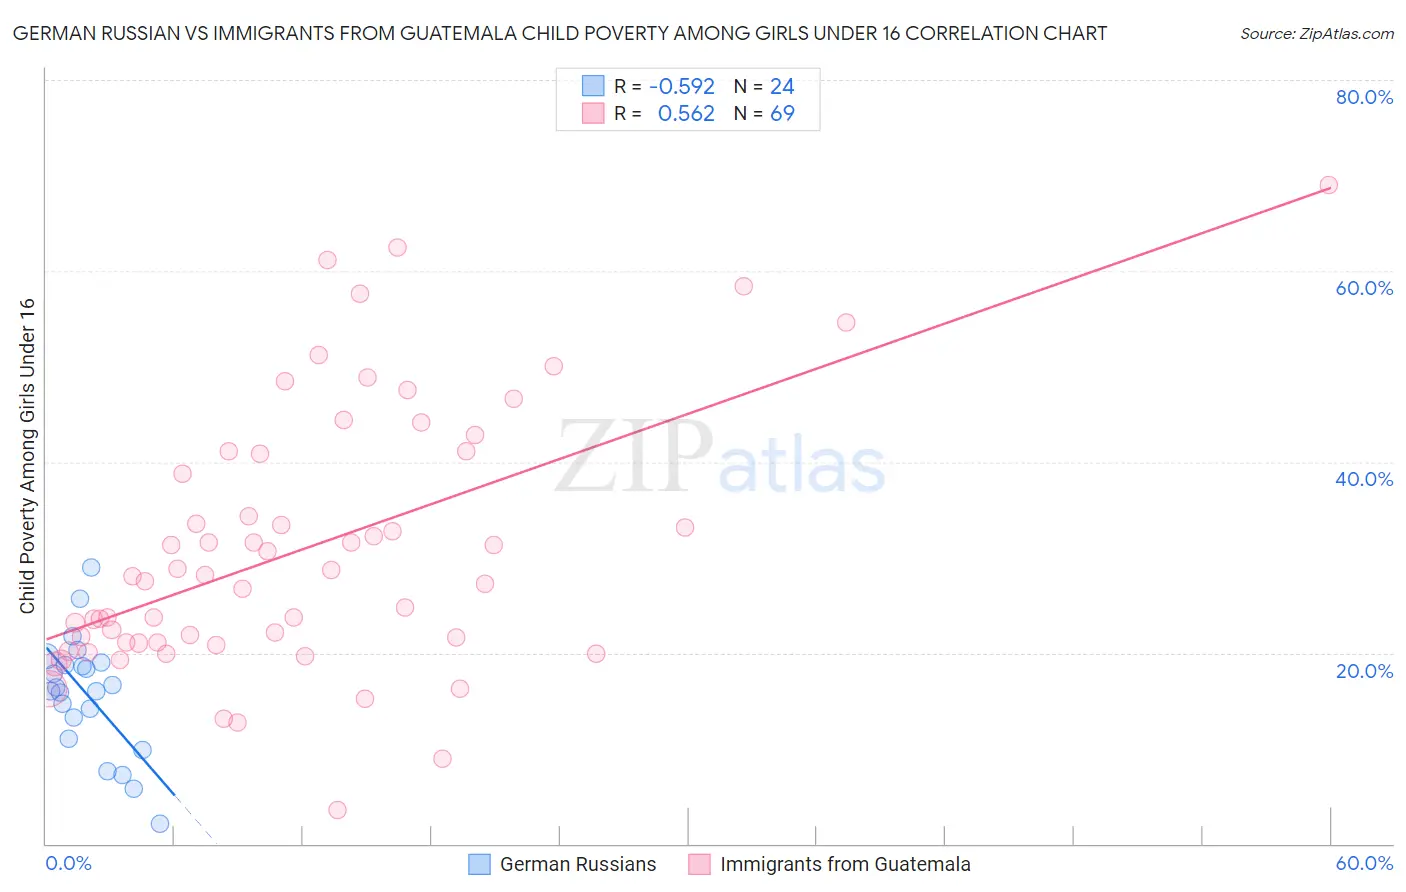
German Russian vs Immigrants from Guatemala Child Poverty Among Girls Under 16 Correlation Chart
The statistical analysis conducted on geographies consisting of 96,035,959 people shows a substantial negative correlation between the proportion of German Russians and poverty level among girls under the age of 16 in the United States with a correlation coefficient (R) of -0.592 and weighted average of 17.8%. Similarly, the statistical analysis conducted on geographies consisting of 372,986,331 people shows a substantial positive correlation between the proportion of Immigrants from Guatemala and poverty level among girls under the age of 16 in the United States with a correlation coefficient (R) of 0.562 and weighted average of 21.9%, a difference of 22.8%.
Child Poverty Among Girls Under 16 Correlation Summary
| Measurement | German Russian | Immigrants from Guatemala |
| Minimum | 2.2% | 3.5% |
| Maximum | 28.9% | 69.0% |
| Range | 26.8% | 65.5% |
| Mean | 15.6% | 30.9% |
| Median | 16.2% | 28.1% |
| Interquartile 25% (IQ1) | 12.1% | 21.1% |
| Interquartile 75% (IQ3) | 18.9% | 40.9% |
| Interquartile Range (IQR) | 6.8% | 19.9% |
| Standard Deviation (Sample) | 6.2% | 13.8% |
| Standard Deviation (Population) | 6.0% | 13.7% |
Similar Demographics by Child Poverty Among Girls Under 16
Demographics Similar to German Russians by Child Poverty Among Girls Under 16
In terms of child poverty among girls under 16, the demographic groups most similar to German Russians are Malaysian (17.8%, a difference of 0.0%), Pennsylvania German (17.8%, a difference of 0.020%), Moroccan (17.8%, a difference of 0.10%), Japanese (17.8%, a difference of 0.19%), and Immigrants from Thailand (17.7%, a difference of 0.28%).
| Demographics | Rating | Rank | Child Poverty Among Girls Under 16 |
| Sierra Leoneans | 8.9 /100 | #208 | Tragic 17.6% |
| Panamanians | 8.7 /100 | #209 | Tragic 17.6% |
| Immigrants | Immigrants | 7.3 /100 | #210 | Tragic 17.7% |
| Immigrants | Eastern Africa | 6.4 /100 | #211 | Tragic 17.7% |
| Immigrants | Thailand | 6.3 /100 | #212 | Tragic 17.7% |
| Pennsylvania Germans | 5.7 /100 | #213 | Tragic 17.8% |
| Malaysians | 5.7 /100 | #214 | Tragic 17.8% |
| German Russians | 5.7 /100 | #215 | Tragic 17.8% |
| Moroccans | 5.5 /100 | #216 | Tragic 17.8% |
| Japanese | 5.3 /100 | #217 | Tragic 17.8% |
| Alaska Natives | 5.2 /100 | #218 | Tragic 17.8% |
| Immigrants | Panama | 4.7 /100 | #219 | Tragic 17.9% |
| Cubans | 4.1 /100 | #220 | Tragic 18.0% |
| Immigrants | Micronesia | 3.5 /100 | #221 | Tragic 18.0% |
| Immigrants | Cambodia | 2.9 /100 | #222 | Tragic 18.1% |
Demographics Similar to Immigrants from Guatemala by Child Poverty Among Girls Under 16
In terms of child poverty among girls under 16, the demographic groups most similar to Immigrants from Guatemala are Ute (21.8%, a difference of 0.27%), African (21.9%, a difference of 0.32%), Arapaho (21.7%, a difference of 0.55%), Creek (21.7%, a difference of 0.56%), and Immigrants from Dominica (22.1%, a difference of 0.99%).
| Demographics | Rating | Rank | Child Poverty Among Girls Under 16 |
| Bahamians | 0.0 /100 | #309 | Tragic 21.5% |
| Immigrants | Somalia | 0.0 /100 | #310 | Tragic 21.6% |
| Dutch West Indians | 0.0 /100 | #311 | Tragic 21.6% |
| Immigrants | Mexico | 0.0 /100 | #312 | Tragic 21.6% |
| Creek | 0.0 /100 | #313 | Tragic 21.7% |
| Arapaho | 0.0 /100 | #314 | Tragic 21.7% |
| Ute | 0.0 /100 | #315 | Tragic 21.8% |
| Immigrants | Guatemala | 0.0 /100 | #316 | Tragic 21.9% |
| Africans | 0.0 /100 | #317 | Tragic 21.9% |
| Immigrants | Dominica | 0.0 /100 | #318 | Tragic 22.1% |
| U.S. Virgin Islanders | 0.0 /100 | #319 | Tragic 22.1% |
| Hondurans | 0.0 /100 | #320 | Tragic 22.2% |
| Colville | 0.0 /100 | #321 | Tragic 22.5% |
| Yakama | 0.0 /100 | #322 | Tragic 22.6% |
| Cajuns | 0.0 /100 | #323 | Tragic 22.6% |