German Russian vs Costa Rican 4th Grade
COMPARE
German Russian
Costa Rican
4th Grade
4th Grade Comparison
German Russians
Costa Ricans
97.9%
4TH GRADE
97.5/ 100
METRIC RATING
105th/ 347
METRIC RANK
97.3%
4TH GRADE
8.3/ 100
METRIC RATING
213th/ 347
METRIC RANK
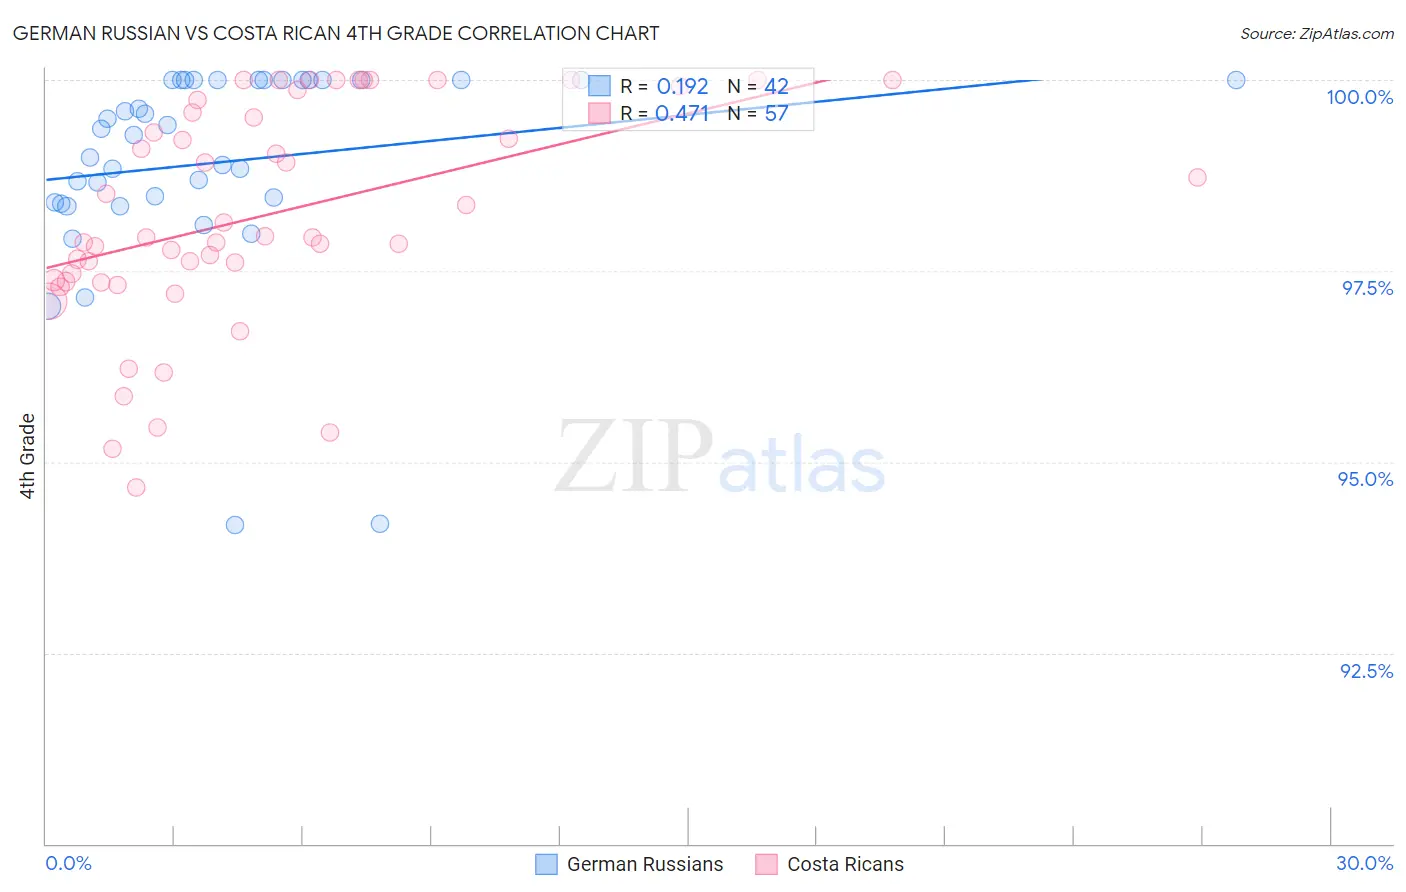
German Russian vs Costa Rican 4th Grade Correlation Chart
The statistical analysis conducted on geographies consisting of 96,461,520 people shows a poor positive correlation between the proportion of German Russians and percentage of population with at least 4th grade education in the United States with a correlation coefficient (R) of 0.192 and weighted average of 97.9%. Similarly, the statistical analysis conducted on geographies consisting of 253,599,979 people shows a moderate positive correlation between the proportion of Costa Ricans and percentage of population with at least 4th grade education in the United States with a correlation coefficient (R) of 0.471 and weighted average of 97.3%, a difference of 0.58%.
4th Grade Correlation Summary
| Measurement | German Russian | Costa Rican |
| Minimum | 94.2% | 94.7% |
| Maximum | 100.0% | 100.0% |
| Range | 5.8% | 5.3% |
| Mean | 98.9% | 98.2% |
| Median | 99.3% | 97.9% |
| Interquartile 25% (IQ1) | 98.4% | 97.4% |
| Interquartile 75% (IQ3) | 100.0% | 99.7% |
| Interquartile Range (IQR) | 1.6% | 2.3% |
| Standard Deviation (Sample) | 1.4% | 1.4% |
| Standard Deviation (Population) | 1.3% | 1.4% |
Similar Demographics by 4th Grade
Demographics Similar to German Russians by 4th Grade
In terms of 4th grade, the demographic groups most similar to German Russians are Nonimmigrants (97.9%, a difference of 0.0%), Immigrants from Czechoslovakia (97.9%, a difference of 0.0%), Puget Sound Salish (97.9%, a difference of 0.010%), Bhutanese (97.9%, a difference of 0.010%), and Immigrants from Singapore (97.9%, a difference of 0.010%).
| Demographics | Rating | Rank | 4th Grade |
| South Africans | 98.2 /100 | #98 | Exceptional 97.9% |
| Turks | 98.2 /100 | #99 | Exceptional 97.9% |
| Yugoslavians | 98.1 /100 | #100 | Exceptional 97.9% |
| Cree | 98.1 /100 | #101 | Exceptional 97.9% |
| Choctaw | 97.9 /100 | #102 | Exceptional 97.9% |
| Puget Sound Salish | 97.7 /100 | #103 | Exceptional 97.9% |
| Immigrants | Nonimmigrants | 97.5 /100 | #104 | Exceptional 97.9% |
| German Russians | 97.5 /100 | #105 | Exceptional 97.9% |
| Immigrants | Czechoslovakia | 97.5 /100 | #106 | Exceptional 97.9% |
| Bhutanese | 97.4 /100 | #107 | Exceptional 97.9% |
| Immigrants | Singapore | 97.3 /100 | #108 | Exceptional 97.9% |
| Immigrants | Latvia | 96.8 /100 | #109 | Exceptional 97.8% |
| Thais | 96.7 /100 | #110 | Exceptional 97.8% |
| Immigrants | Switzerland | 96.1 /100 | #111 | Exceptional 97.8% |
| Okinawans | 96.0 /100 | #112 | Exceptional 97.8% |
Demographics Similar to Costa Ricans by 4th Grade
In terms of 4th grade, the demographic groups most similar to Costa Ricans are Tohono O'odham (97.3%, a difference of 0.0%), Laotian (97.3%, a difference of 0.010%), Immigrants from Oceania (97.3%, a difference of 0.010%), Sudanese (97.3%, a difference of 0.010%), and Immigrants from Nepal (97.3%, a difference of 0.010%).
| Demographics | Rating | Rank | 4th Grade |
| Immigrants | Zaire | 12.8 /100 | #206 | Poor 97.3% |
| Moroccans | 11.3 /100 | #207 | Poor 97.3% |
| Immigrants | Bahamas | 10.8 /100 | #208 | Poor 97.3% |
| Laotians | 9.3 /100 | #209 | Tragic 97.3% |
| Immigrants | Oceania | 9.1 /100 | #210 | Tragic 97.3% |
| Sudanese | 9.0 /100 | #211 | Tragic 97.3% |
| Tohono O'odham | 8.4 /100 | #212 | Tragic 97.3% |
| Costa Ricans | 8.3 /100 | #213 | Tragic 97.3% |
| Immigrants | Nepal | 7.7 /100 | #214 | Tragic 97.3% |
| Immigrants | Morocco | 7.1 /100 | #215 | Tragic 97.3% |
| Samoans | 6.8 /100 | #216 | Tragic 97.3% |
| Sierra Leoneans | 6.5 /100 | #217 | Tragic 97.3% |
| Iraqis | 6.3 /100 | #218 | Tragic 97.3% |
| Tongans | 5.8 /100 | #219 | Tragic 97.3% |
| South American Indians | 5.5 /100 | #220 | Tragic 97.3% |