French vs Nonimmigrants Median Household Income

COMPARE

French
Race
Ancestry
AfghanAfricanAlaska NativeAlaskan AthabascanAlbanianAleutAlsatianAmericanApacheArabArapahoArgentineanArmenianAssyrian/Chaldean/SyriacAustralianAustrianBahamianBangladeshiBarbadianBasqueBelgianBelizeanBermudanBhutaneseBlackfeetBolivianBrazilianBritishBritish West IndianBulgarianBurmeseCajunCambodianCanadianCape VerdeanCarpatho RusynCelticCentral AmericanCentral American IndianCherokeeCheyenneChickasawChileanChineseChippewaChoctawColombianColvilleComancheCosta RicanCreeCreekCroatianCrowCubanCypriotCzechCzechoslovakianDanishDelawareDominicanDutchDutch West IndianEastern EuropeanEcuadorianEgyptianEnglishEstonianEthiopianEuropeanFijianFilipinoFinnishFrenchFrench American IndianFrench CanadianGermanGerman RussianGhanaianGreekGuamanian/ChamorroGuatemalanGuyaneseHaitianHmongHonduranHopiHoumaHungarianIcelanderIndian (Asian)IndonesianInupiatIranianIraqiIrishIroquoisIsraeliItalianJamaicanJapaneseJordanianKenyanKiowaKoreanLaotianLatvianLebaneseLiberianLithuanianLumbeeLuxembourgerMacedonianMalaysianMalteseMarshalleseMenomineeMexicanMexican American IndianMongolianMoroccanNative HawaiianNavajoNepaleseNew ZealanderNicaraguanNigerianNorthern EuropeanNorwegianOkinawanOsageOttawaPaiutePakistaniPalestinianPanamanianParaguayanPennsylvania GermanPeruvianPimaPolishPortuguesePotawatomiPuebloPuerto RicanPuget Sound SalishRomanianRussianSalvadoranSamoanScandinavianScotch-IrishScottishSeminoleSenegaleseSerbianShoshoneSierra LeoneanSiouxSlavicSlovakSloveneSomaliSouth AfricanSouth AmericanSouth American IndianSoviet UnionSpaniardSpanishSpanish AmericanSpanish American IndianSri LankanSubsaharan AfricanSudaneseSwedishSwissSyrianTaiwaneseThaiTlingit-HaidaTohono O'OdhamTonganTrinidadian and TobagonianTsimshianTurkishU.S. Virgin IslanderUgandanUkrainianUruguayanUteVenezuelanVietnameseWelshWest IndianYakamaYaquiYugoslavianYumanYup'ikZimbabwean
Immigration
ImmigrantsAfghanistanAfricaAlbaniaArgentinaArmeniaAsiaAustraliaAustriaBahamasBangladeshBarbadosBelarusBelgiumBelizeBoliviaBosnia and HerzegovinaBrazilBulgariaBurma/MyanmarCabo VerdeCambodiaCameroonCanadaCaribbeanCentral AmericaChileChinaColombiaCongoCosta RicaCroatiaCubaCzechoslovakiaDenmarkDominicaDominican RepublicEastern AfricaEastern AsiaEastern EuropeEcuadorEgyptEl SalvadorEnglandEritreaEthiopiaEuropeFijiFranceGermanyGhanaGreeceGrenadaGuatemalaGuyanaHaitiHondurasHong KongHungaryIndiaIndonesiaIranIraqIrelandIsraelItalyJamaicaJapanJordanKazakhstanKenyaKoreaKuwaitLaosLatin AmericaLatviaLebanonLiberiaLithuaniaMalaysiaMexicoMicronesiaMiddle AfricaMoldovaMoroccoNepalNetherlandsNicaraguaNigeriaNorth AmericaNorth MacedoniaNorthern AfricaNorthern EuropeNorwayOceaniaPakistanPanamaPeruPhilippinesPolandPortugalRomaniaRussiaSaudi ArabiaScotlandSenegalSerbiaSierra LeoneSingaporeSomaliaSouth AfricaSouth AmericaSouth Central AsiaSouth Eastern AsiaSouthern EuropeSpainSri LankaSt. Vincent and the GrenadinesSudanSwedenSwitzerlandSyriaTaiwanThailandTrinidad and TobagoTurkeyUgandaUkraineUruguayUzbekistanVenezuelaVietnamWest IndiesWestern AfricaWestern AsiaWestern EuropeYemenZaireZimbabweAzores
Nonimmigrants
Race
Ancestry
AfghanAfricanAlaska NativeAlaskan AthabascanAlbanianAleutAlsatianAmericanApacheArabArapahoArgentineanArmenianAssyrian/Chaldean/SyriacAustralianAustrianBahamianBangladeshiBarbadianBasqueBelgianBelizeanBermudanBhutaneseBlackfeetBolivianBrazilianBritishBritish West IndianBulgarianBurmeseCajunCambodianCanadianCape VerdeanCarpatho RusynCelticCentral AmericanCentral American IndianCherokeeCheyenneChickasawChileanChineseChippewaChoctawColombianColvilleComancheCosta RicanCreeCreekCroatianCrowCubanCypriotCzechCzechoslovakianDanishDelawareDominicanDutchDutch West IndianEastern EuropeanEcuadorianEgyptianEnglishEstonianEthiopianEuropeanFijianFilipinoFinnishFrench American IndianFrench CanadianGermanGerman RussianGhanaianGreekGuamanian/ChamorroGuatemalanGuyaneseHaitianHmongHonduranHopiHoumaHungarianIcelanderIndian (Asian)IndonesianInupiatIranianIraqiIrishIroquoisIsraeliItalianJamaicanJapaneseJordanianKenyanKiowaKoreanLaotianLatvianLebaneseLiberianLithuanianLumbeeLuxembourgerMacedonianMalaysianMalteseMarshalleseMenomineeMexicanMexican American IndianMongolianMoroccanNative HawaiianNavajoNepaleseNew ZealanderNicaraguanNigerianNorthern EuropeanNorwegianOkinawanOsageOttawaPaiutePakistaniPalestinianPanamanianParaguayanPennsylvania GermanPeruvianPimaPolishPortuguesePotawatomiPuebloPuerto RicanPuget Sound SalishRomanianRussianSalvadoranSamoanScandinavianScotch-IrishScottishSeminoleSenegaleseSerbianShoshoneSierra LeoneanSiouxSlavicSlovakSloveneSomaliSouth AfricanSouth AmericanSouth American IndianSoviet UnionSpaniardSpanishSpanish AmericanSpanish American IndianSri LankanSubsaharan AfricanSudaneseSwedishSwissSyrianTaiwaneseThaiTlingit-HaidaTohono O'OdhamTonganTrinidadian and TobagonianTsimshianTurkishU.S. Virgin IslanderUgandanUkrainianUruguayanUteVenezuelanVietnameseWelshWest IndianYakamaYaquiYugoslavianYumanYup'ikZimbabwean
Immigration
NonimmigrantsImmigrantsAfghanistanAfricaAlbaniaArgentinaArmeniaAsiaAustraliaAustriaBahamasBangladeshBarbadosBelarusBelgiumBelizeBoliviaBosnia and HerzegovinaBrazilBulgariaBurma/MyanmarCabo VerdeCambodiaCameroonCanadaCaribbeanCentral AmericaChileChinaColombiaCongoCosta RicaCroatiaCubaCzechoslovakiaDenmarkDominicaDominican RepublicEastern AfricaEastern AsiaEastern EuropeEcuadorEgyptEl SalvadorEnglandEritreaEthiopiaEuropeFijiFranceGermanyGhanaGreeceGrenadaGuatemalaGuyanaHaitiHondurasHong KongHungaryIndiaIndonesiaIranIraqIrelandIsraelItalyJamaicaJapanJordanKazakhstanKenyaKoreaKuwaitLaosLatin AmericaLatviaLebanonLiberiaLithuaniaMalaysiaMexicoMicronesiaMiddle AfricaMoldovaMoroccoNepalNetherlandsNicaraguaNigeriaNorth AmericaNorth MacedoniaNorthern AfricaNorthern EuropeNorwayOceaniaPakistanPanamaPeruPhilippinesPolandPortugalRomaniaRussiaSaudi ArabiaScotlandSenegalSerbiaSierra LeoneSingaporeSomaliaSouth AfricaSouth AmericaSouth Central AsiaSouth Eastern AsiaSouthern EuropeSpainSri LankaSt. Vincent and the GrenadinesSudanSwedenSwitzerlandSyriaTaiwanThailandTrinidad and TobagoTurkeyUgandaUkraineUruguayUzbekistanVenezuelaVietnamWest IndiesWestern AfricaWestern AsiaWestern EuropeYemenZaireZimbabweAzores
Median Household Income
Income
Poverty
Unemployment
Labor Participation
Family Structure
Vehicle Availability
Education Level
Disability

Median Household Income Comparison

French

Nonimmigrants

Fair
Tragic
$83,468
MEDIAN HOUSEHOLD INCOME
26.0/ 100
METRIC RATING
196th/ 347
METRIC RANK
$79,429
MEDIAN HOUSEHOLD INCOME
2.6/ 100
METRIC RATING
241st/ 347
METRIC RANK

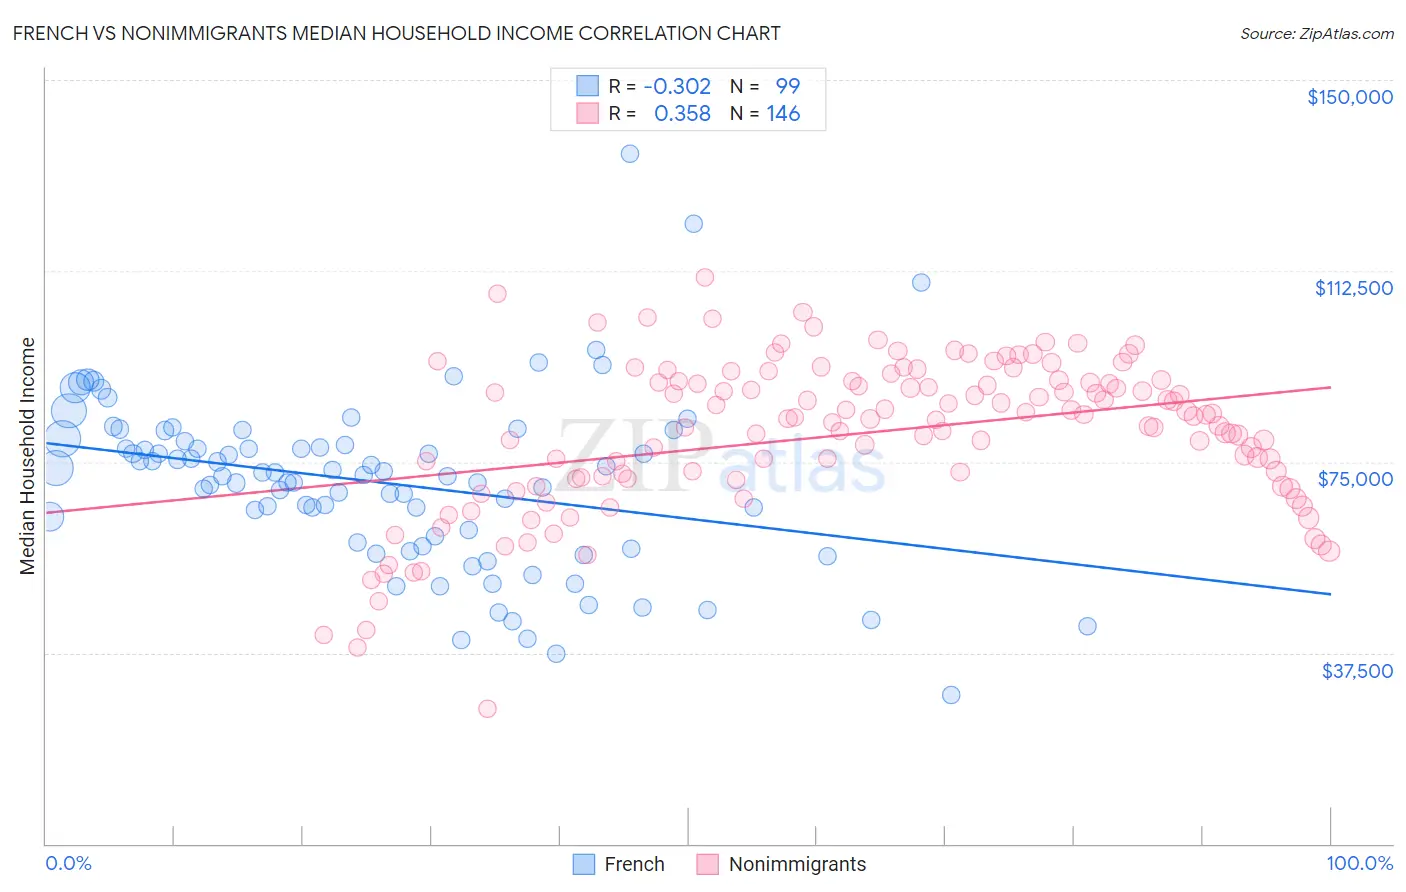
French vs Nonimmigrants Median Household Income Correlation Chart

The statistical analysis conducted on geographies consisting of 571,286,063 people shows a mild negative correlation between the proportion of French and median household income in the United States with a correlation coefficient (R) of -0.302 and weighted average of $83,468. Similarly, the statistical analysis conducted on geographies consisting of 582,891,477 people shows a mild positive correlation between the proportion of Nonimmigrants and median household income in the United States with a correlation coefficient (R) of 0.358 and weighted average of $79,429, a difference of 5.1%.
French vs Nonimmigrants Median Household Income

Median Household Income Correlation Summary

MeasurementFrenchNonimmigrants
Minimum$29,263$26,558
Maximum$135,625$111,218
Range$106,362$84,660
Mean$70,877$80,540
Median$72,372$83,608
Interquartile 25% (IQ1)$59,090$71,762
Interquartile 75% (IQ3)$79,064$90,776
Interquartile Range (IQR)$19,974$19,014
Standard Deviation (Sample)$17,004$15,013
Standard Deviation (Population)$16,918$14,961

Similar Demographics by Median Household Income

Demographics Similar to French by Median Household Income

In terms of median household income, the demographic groups most similar to French are Aleut ($83,446, a difference of 0.030%), Japanese ($83,395, a difference of 0.090%), Immigrants from Armenia ($83,555, a difference of 0.10%), German ($83,358, a difference of 0.13%), and Ghanaian ($83,582, a difference of 0.14%).
DemographicsRating | RankMedian Household Income
Immigrants | Colombia
31.7
/100
|
#189
Fair
$83,902
Slovaks
30.2
/100
|
#190
Fair
$83,798
Iraqis
29.6
/100
|
#191
Fair
$83,753
Welsh
28.0
/100
|
#192
Fair
$83,628
Finns
27.7
/100
|
#193
Fair
$83,607
Ghanaians
27.4
/100
|
#194
Fair
$83,582
Immigrants | Armenia
27.0
/100
|
#195
Fair
$83,555
French
26.0
/100
|
#196
Fair
$83,468
Aleuts
25.7
/100
|
#197
Fair
$83,446
Japanese
25.1
/100
|
#198
Fair
$83,395
Germans
24.6
/100
|
#199
Fair
$83,358
Tsimshian
24.5
/100
|
#200
Fair
$83,346
Spanish
24.4
/100
|
#201
Fair
$83,343
Immigrants | Thailand
24.3
/100
|
#202
Fair
$83,327
Immigrants | Cambodia
24.0
/100
|
#203
Fair
$83,304

Demographics Similar to Nonimmigrants by Median Household Income

In terms of median household income, the demographic groups most similar to Nonimmigrants are Immigrants from Western Africa ($79,490, a difference of 0.080%), Alaska Native ($79,509, a difference of 0.10%), Barbadian ($79,664, a difference of 0.30%), Nicaraguan ($79,737, a difference of 0.39%), and Immigrants from Sudan ($79,103, a difference of 0.41%).
DemographicsRating | RankMedian Household Income
Immigrants | Ecuador
4.5
/100
|
#234
Tragic
$80,341
Immigrants | Guyana
4.5
/100
|
#235
Tragic
$80,324
Immigrants | Bosnia and Herzegovina
3.4
/100
|
#236
Tragic
$79,888
Nicaraguans
3.1
/100
|
#237
Tragic
$79,737
Barbadians
3.0
/100
|
#238
Tragic
$79,664
Alaska Natives
2.7
/100
|
#239
Tragic
$79,509
Immigrants | Western Africa
2.7
/100
|
#240
Tragic
$79,490
Immigrants | Nonimmigrants
2.6
/100
|
#241
Tragic
$79,429
Immigrants | Sudan
2.1
/100
|
#242
Tragic
$79,103
Immigrants | Barbados
1.9
/100
|
#243
Tragic
$78,989
Marshallese
1.9
/100
|
#244
Tragic
$78,930
Inupiat
1.8
/100
|
#245
Tragic
$78,841
Central Americans
1.7
/100
|
#246
Tragic
$78,803
Immigrants | Burma/Myanmar
1.6
/100
|
#247
Tragic
$78,682
Sudanese
1.5
/100
|
#248
Tragic
$78,529