French vs Immigrants from Nepal Unemployment Among Seniors over 75 years
COMPARE
French
Immigrants from Nepal
Unemployment Among Seniors over 75 years
Unemployment Among Seniors over 75 years Comparison
French
Immigrants from Nepal
10.3%
UNEMPLOYMENT AMONG SENIORS OVER 75 YEARS
0.0/ 100
METRIC RATING
320th/ 347
METRIC RANK
8.3%
UNEMPLOYMENT AMONG SENIORS OVER 75 YEARS
96.9/ 100
METRIC RATING
123rd/ 347
METRIC RANK
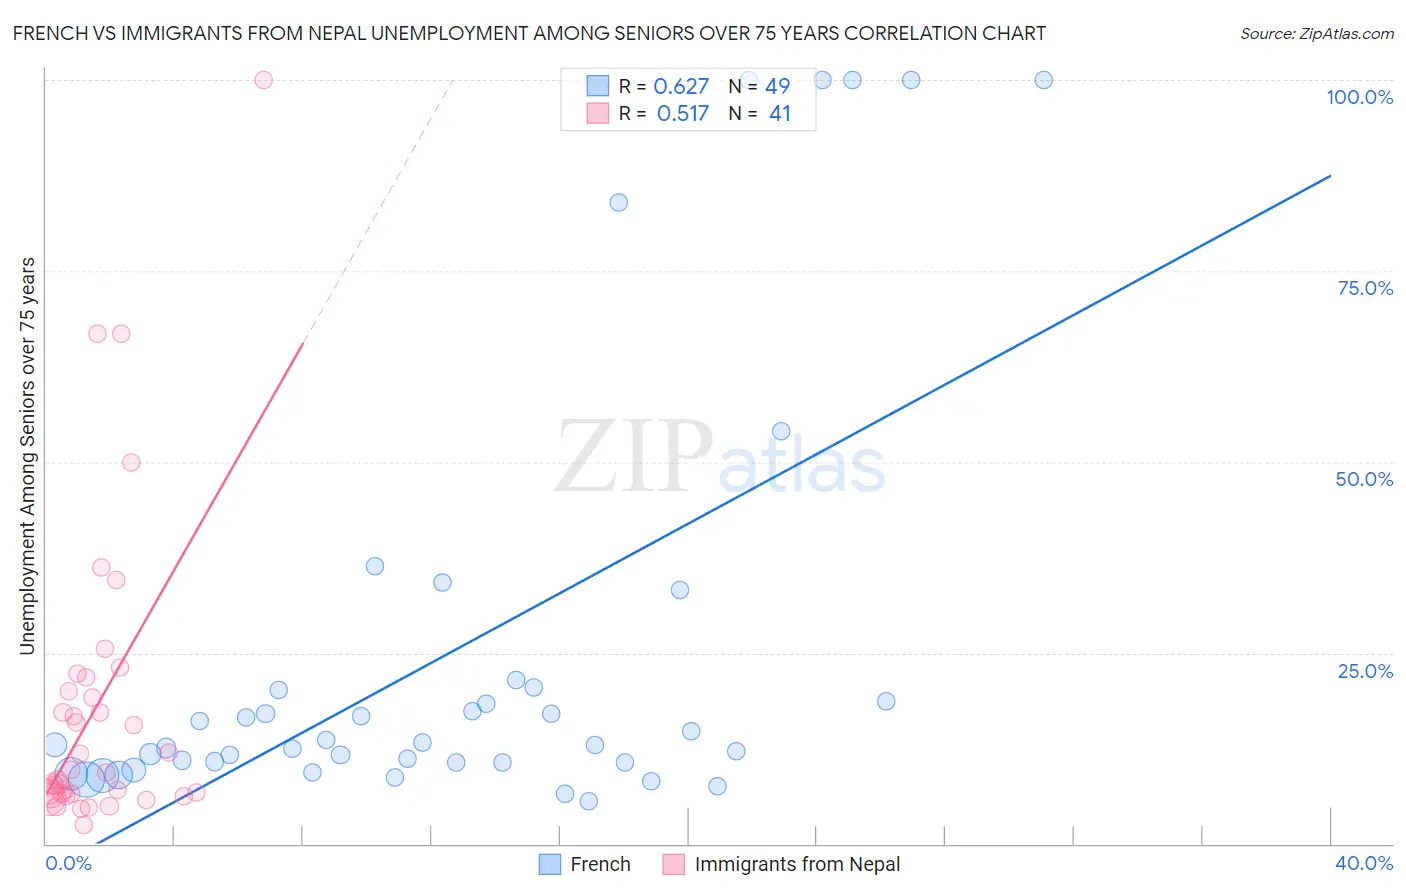
French vs Immigrants from Nepal Unemployment Among Seniors over 75 years Correlation Chart
The statistical analysis conducted on geographies consisting of 234,968,418 people shows a significant positive correlation between the proportion of French and unemployment rate among seniors over the age of 75 in the United States with a correlation coefficient (R) of 0.627 and weighted average of 10.3%. Similarly, the statistical analysis conducted on geographies consisting of 118,449,831 people shows a substantial positive correlation between the proportion of Immigrants from Nepal and unemployment rate among seniors over the age of 75 in the United States with a correlation coefficient (R) of 0.517 and weighted average of 8.3%, a difference of 23.2%.
Unemployment Among Seniors over 75 years Correlation Summary
| Measurement | French | Immigrants from Nepal |
| Minimum | 5.6% | 2.4% |
| Maximum | 100.0% | 100.0% |
| Range | 94.4% | 97.6% |
| Mean | 25.2% | 18.0% |
| Median | 13.0% | 9.3% |
| Interquartile 25% (IQ1) | 10.6% | 6.5% |
| Interquartile 75% (IQ3) | 20.3% | 20.9% |
| Interquartile Range (IQR) | 9.7% | 14.4% |
| Standard Deviation (Sample) | 28.6% | 20.2% |
| Standard Deviation (Population) | 28.3% | 19.9% |
Similar Demographics by Unemployment Among Seniors over 75 years
Demographics Similar to French by Unemployment Among Seniors over 75 years
In terms of unemployment among seniors over 75 years, the demographic groups most similar to French are Aleut (10.3%, a difference of 0.010%), German (10.3%, a difference of 0.22%), Liberian (10.2%, a difference of 0.29%), Polish (10.3%, a difference of 0.37%), and Irish (10.2%, a difference of 0.42%).
| Demographics | Rating | Rank | Unemployment Among Seniors over 75 years |
| Nepalese | 0.0 /100 | #313 | Tragic 10.1% |
| Dutch West Indians | 0.0 /100 | #314 | Tragic 10.2% |
| Pennsylvania Germans | 0.0 /100 | #315 | Tragic 10.2% |
| Natives/Alaskans | 0.0 /100 | #316 | Tragic 10.2% |
| Irish | 0.0 /100 | #317 | Tragic 10.2% |
| Liberians | 0.0 /100 | #318 | Tragic 10.2% |
| Germans | 0.0 /100 | #319 | Tragic 10.3% |
| French | 0.0 /100 | #320 | Tragic 10.3% |
| Aleuts | 0.0 /100 | #321 | Tragic 10.3% |
| Poles | 0.0 /100 | #322 | Tragic 10.3% |
| Tongans | 0.0 /100 | #323 | Tragic 10.4% |
| Americans | 0.0 /100 | #324 | Tragic 10.4% |
| Portuguese | 0.0 /100 | #325 | Tragic 10.4% |
| Slovaks | 0.0 /100 | #326 | Tragic 10.4% |
| Dutch | 0.0 /100 | #327 | Tragic 10.4% |
Demographics Similar to Immigrants from Nepal by Unemployment Among Seniors over 75 years
In terms of unemployment among seniors over 75 years, the demographic groups most similar to Immigrants from Nepal are Thai (8.3%, a difference of 0.040%), Immigrants from Moldova (8.3%, a difference of 0.060%), Immigrants from Russia (8.3%, a difference of 0.080%), Immigrants from Croatia (8.3%, a difference of 0.15%), and Immigrants from Asia (8.3%, a difference of 0.27%).
| Demographics | Rating | Rank | Unemployment Among Seniors over 75 years |
| Immigrants | West Indies | 98.1 /100 | #116 | Exceptional 8.3% |
| Immigrants | Greece | 97.9 /100 | #117 | Exceptional 8.3% |
| Immigrants | Middle Africa | 97.9 /100 | #118 | Exceptional 8.3% |
| Japanese | 97.5 /100 | #119 | Exceptional 8.3% |
| Immigrants | Asia | 97.4 /100 | #120 | Exceptional 8.3% |
| Immigrants | Croatia | 97.2 /100 | #121 | Exceptional 8.3% |
| Immigrants | Russia | 97.1 /100 | #122 | Exceptional 8.3% |
| Immigrants | Nepal | 96.9 /100 | #123 | Exceptional 8.3% |
| Thais | 96.8 /100 | #124 | Exceptional 8.3% |
| Immigrants | Moldova | 96.7 /100 | #125 | Exceptional 8.3% |
| Belizeans | 96.3 /100 | #126 | Exceptional 8.4% |
| Hondurans | 96.2 /100 | #127 | Exceptional 8.4% |
| Native Hawaiians | 96.1 /100 | #128 | Exceptional 8.4% |
| Ghanaians | 96.0 /100 | #129 | Exceptional 8.4% |
| Apache | 95.2 /100 | #130 | Exceptional 8.4% |