French Canadian vs Menominee Single Mother Households
COMPARE
French Canadian
Menominee
Single Mother Households
Single Mother Households Comparison
French Canadians
Menominee
6.0%
SINGLE MOTHER HOUSEHOLDS
82.6/ 100
METRIC RATING
146th/ 347
METRIC RANK
9.2%
SINGLE MOTHER HOUSEHOLDS
0.0/ 100
METRIC RATING
342nd/ 347
METRIC RANK
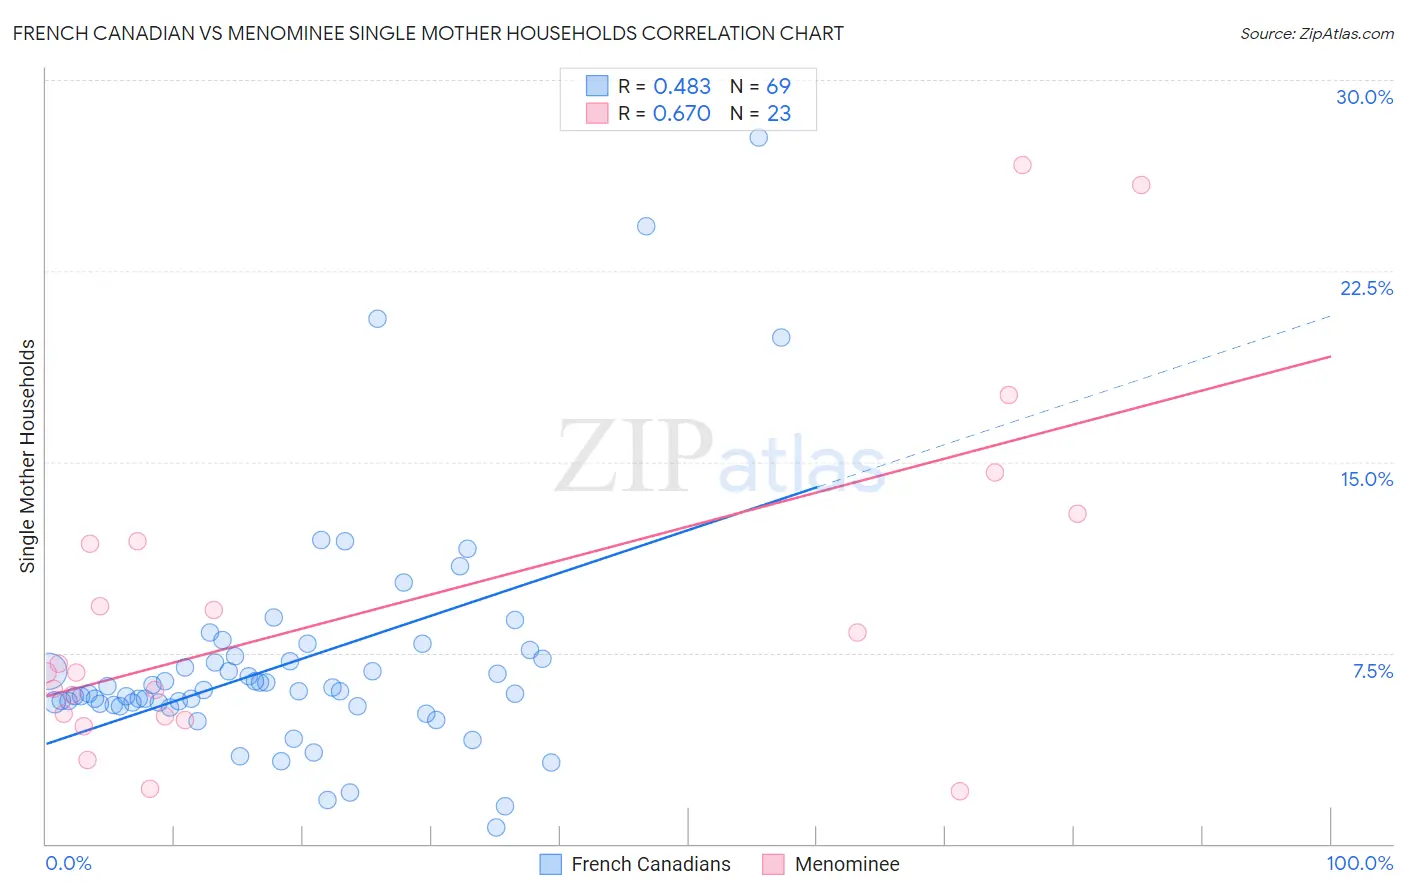
French Canadian vs Menominee Single Mother Households Correlation Chart
The statistical analysis conducted on geographies consisting of 499,765,796 people shows a moderate positive correlation between the proportion of French Canadians and percentage of single mother households in the United States with a correlation coefficient (R) of 0.483 and weighted average of 6.0%. Similarly, the statistical analysis conducted on geographies consisting of 45,774,127 people shows a significant positive correlation between the proportion of Menominee and percentage of single mother households in the United States with a correlation coefficient (R) of 0.670 and weighted average of 9.2%, a difference of 51.6%.
Single Mother Households Correlation Summary
| Measurement | French Canadian | Menominee |
| Minimum | 0.62% | 2.0% |
| Maximum | 27.8% | 26.7% |
| Range | 27.1% | 24.6% |
| Mean | 7.1% | 9.3% |
| Median | 6.0% | 6.7% |
| Interquartile 25% (IQ1) | 5.5% | 5.0% |
| Interquartile 75% (IQ3) | 7.3% | 11.9% |
| Interquartile Range (IQR) | 1.8% | 6.9% |
| Standard Deviation (Sample) | 4.6% | 6.6% |
| Standard Deviation (Population) | 4.6% | 6.5% |
Similar Demographics by Single Mother Households
Demographics Similar to French Canadians by Single Mother Households
In terms of single mother households, the demographic groups most similar to French Canadians are Immigrants from Jordan (6.0%, a difference of 0.060%), Scotch-Irish (6.0%, a difference of 0.11%), Immigrants from Albania (6.1%, a difference of 0.21%), Arab (6.0%, a difference of 0.29%), and Zimbabwean (6.1%, a difference of 0.35%).
| Demographics | Rating | Rank | Single Mother Households |
| Syrians | 86.0 /100 | #139 | Excellent 6.0% |
| French | 85.7 /100 | #140 | Excellent 6.0% |
| Tsimshian | 85.2 /100 | #141 | Excellent 6.0% |
| Immigrants | Egypt | 85.0 /100 | #142 | Excellent 6.0% |
| Immigrants | Iraq | 84.8 /100 | #143 | Excellent 6.0% |
| Koreans | 84.4 /100 | #144 | Excellent 6.0% |
| Arabs | 84.0 /100 | #145 | Excellent 6.0% |
| French Canadians | 82.6 /100 | #146 | Excellent 6.0% |
| Immigrants | Jordan | 82.3 /100 | #147 | Excellent 6.0% |
| Scotch-Irish | 82.0 /100 | #148 | Excellent 6.0% |
| Immigrants | Albania | 81.5 /100 | #149 | Excellent 6.1% |
| Zimbabweans | 80.7 /100 | #150 | Excellent 6.1% |
| Immigrants | Southern Europe | 80.5 /100 | #151 | Excellent 6.1% |
| Pakistanis | 79.2 /100 | #152 | Good 6.1% |
| Immigrants | Brazil | 78.9 /100 | #153 | Good 6.1% |
Demographics Similar to Menominee by Single Mother Households
In terms of single mother households, the demographic groups most similar to Menominee are Dominican (9.2%, a difference of 0.21%), Tohono O'odham (9.1%, a difference of 0.32%), Lumbee (9.1%, a difference of 0.68%), Black/African American (9.0%, a difference of 1.9%), and Cape Verdean (8.9%, a difference of 3.5%).
| Demographics | Rating | Rank | Single Mother Households |
| Liberians | 0.0 /100 | #333 | Tragic 8.6% |
| Immigrants | Liberia | 0.0 /100 | #334 | Tragic 8.7% |
| Immigrants | Dominica | 0.0 /100 | #335 | Tragic 8.7% |
| Puerto Ricans | 0.0 /100 | #336 | Tragic 8.7% |
| Navajo | 0.0 /100 | #337 | Tragic 8.8% |
| Cape Verdeans | 0.0 /100 | #338 | Tragic 8.9% |
| Blacks/African Americans | 0.0 /100 | #339 | Tragic 9.0% |
| Lumbee | 0.0 /100 | #340 | Tragic 9.1% |
| Tohono O'odham | 0.0 /100 | #341 | Tragic 9.1% |
| Menominee | 0.0 /100 | #342 | Tragic 9.2% |
| Dominicans | 0.0 /100 | #343 | Tragic 9.2% |
| Immigrants | Dominican Republic | 0.0 /100 | #344 | Tragic 9.5% |
| Immigrants | Cabo Verde | 0.0 /100 | #345 | Tragic 9.6% |
| Yuman | 0.0 /100 | #346 | Tragic 9.6% |
| Yup'ik | 0.0 /100 | #347 | Tragic 10.0% |