French Canadian vs Immigrants from Egypt Female Poverty Among 25-34 Year Olds
COMPARE
French Canadian
Immigrants from Egypt
Female Poverty Among 25-34 Year Olds
Female Poverty Among 25-34 Year Olds Comparison
French Canadians
Immigrants from Egypt
14.3%
FEMALE POVERTY AMONG 25-34 YEAR OLDS
5.5/ 100
METRIC RATING
216th/ 347
METRIC RANK
12.0%
FEMALE POVERTY AMONG 25-34 YEAR OLDS
99.6/ 100
METRIC RATING
49th/ 347
METRIC RANK
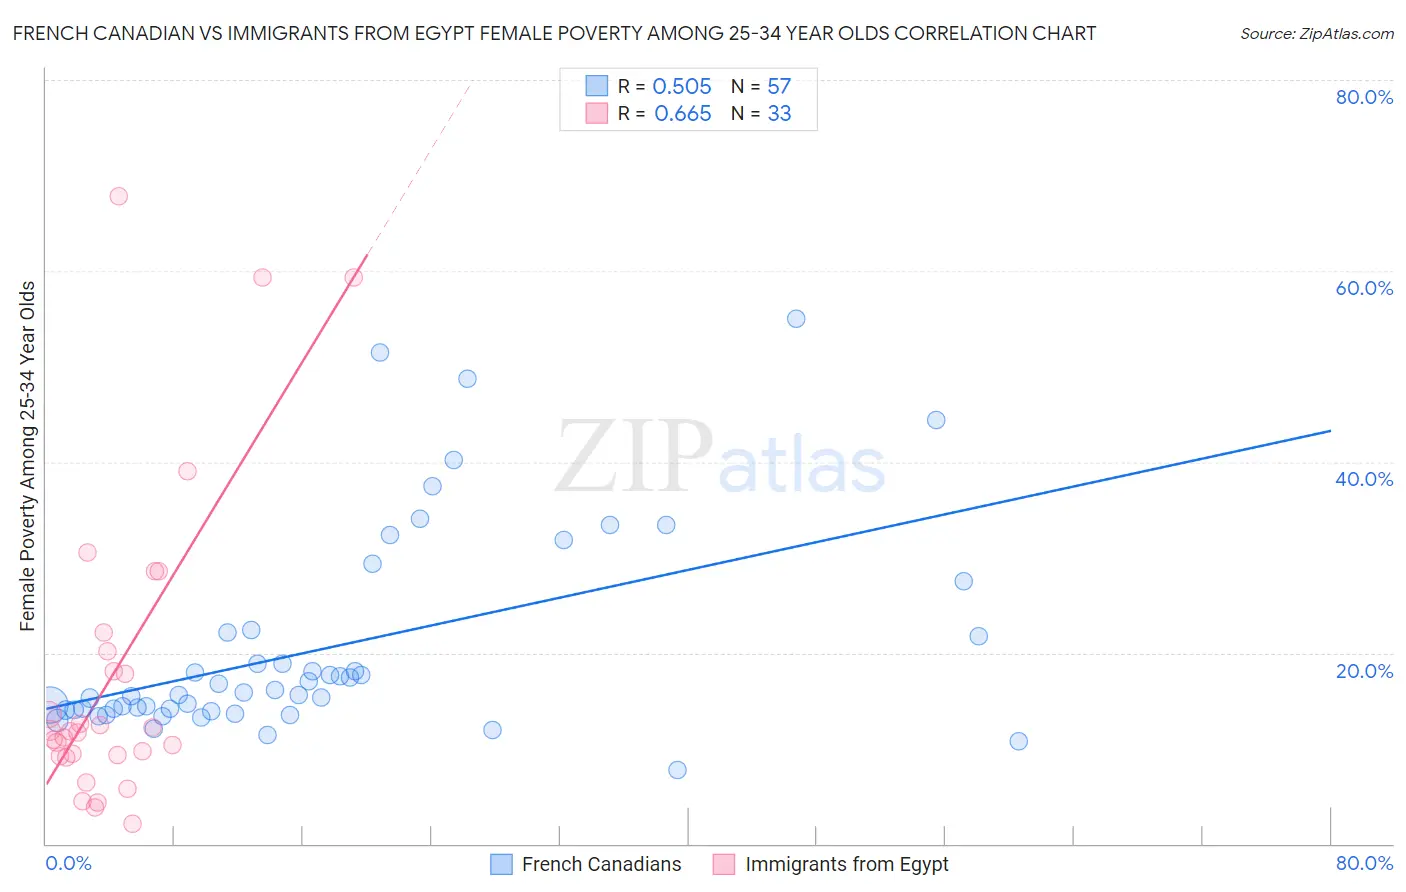
French Canadian vs Immigrants from Egypt Female Poverty Among 25-34 Year Olds Correlation Chart
The statistical analysis conducted on geographies consisting of 488,016,445 people shows a substantial positive correlation between the proportion of French Canadians and poverty level among females between the ages 25 and 34 in the United States with a correlation coefficient (R) of 0.505 and weighted average of 14.3%. Similarly, the statistical analysis conducted on geographies consisting of 242,883,921 people shows a significant positive correlation between the proportion of Immigrants from Egypt and poverty level among females between the ages 25 and 34 in the United States with a correlation coefficient (R) of 0.665 and weighted average of 12.0%, a difference of 19.7%.
Female Poverty Among 25-34 Year Olds Correlation Summary
| Measurement | French Canadian | Immigrants from Egypt |
| Minimum | 7.7% | 2.0% |
| Maximum | 55.0% | 67.8% |
| Range | 47.3% | 65.8% |
| Mean | 20.6% | 18.0% |
| Median | 15.8% | 11.8% |
| Interquartile 25% (IQ1) | 14.0% | 9.2% |
| Interquartile 75% (IQ3) | 22.2% | 21.2% |
| Interquartile Range (IQR) | 8.2% | 11.9% |
| Standard Deviation (Sample) | 10.9% | 16.5% |
| Standard Deviation (Population) | 10.8% | 16.2% |
Similar Demographics by Female Poverty Among 25-34 Year Olds
Demographics Similar to French Canadians by Female Poverty Among 25-34 Year Olds
In terms of female poverty among 25-34 year olds, the demographic groups most similar to French Canadians are Spanish American Indian (14.3%, a difference of 0.0%), Immigrants from Thailand (14.3%, a difference of 0.11%), Ecuadorian (14.3%, a difference of 0.12%), Immigrants from Nigeria (14.3%, a difference of 0.25%), and French (14.3%, a difference of 0.27%).
| Demographics | Rating | Rank | Female Poverty Among 25-34 Year Olds |
| Guyanese | 8.6 /100 | #209 | Tragic 14.2% |
| Panamanians | 8.6 /100 | #210 | Tragic 14.2% |
| Trinidadians and Tobagonians | 8.2 /100 | #211 | Tragic 14.2% |
| Immigrants | Guyana | 6.6 /100 | #212 | Tragic 14.3% |
| Puget Sound Salish | 6.5 /100 | #213 | Tragic 14.3% |
| French | 6.2 /100 | #214 | Tragic 14.3% |
| Immigrants | Nigeria | 6.2 /100 | #215 | Tragic 14.3% |
| French Canadians | 5.5 /100 | #216 | Tragic 14.3% |
| Spanish American Indians | 5.5 /100 | #217 | Tragic 14.3% |
| Immigrants | Thailand | 5.2 /100 | #218 | Tragic 14.3% |
| Ecuadorians | 5.2 /100 | #219 | Tragic 14.3% |
| Ghanaians | 4.8 /100 | #220 | Tragic 14.4% |
| Sudanese | 4.4 /100 | #221 | Tragic 14.4% |
| Immigrants | Portugal | 4.3 /100 | #222 | Tragic 14.4% |
| Nigerians | 4.2 /100 | #223 | Tragic 14.4% |
Demographics Similar to Immigrants from Egypt by Female Poverty Among 25-34 Year Olds
In terms of female poverty among 25-34 year olds, the demographic groups most similar to Immigrants from Egypt are Immigrants from Croatia (12.0%, a difference of 0.020%), Paraguayan (12.0%, a difference of 0.020%), Immigrants from Eastern Europe (12.0%, a difference of 0.040%), Immigrants from Belarus (12.0%, a difference of 0.080%), and Korean (12.0%, a difference of 0.13%).
| Demographics | Rating | Rank | Female Poverty Among 25-34 Year Olds |
| Immigrants | Turkey | 99.7 /100 | #42 | Exceptional 11.9% |
| Egyptians | 99.7 /100 | #43 | Exceptional 11.9% |
| Immigrants | Australia | 99.7 /100 | #44 | Exceptional 11.9% |
| Macedonians | 99.7 /100 | #45 | Exceptional 11.9% |
| Immigrants | Serbia | 99.7 /100 | #46 | Exceptional 11.9% |
| Koreans | 99.6 /100 | #47 | Exceptional 12.0% |
| Immigrants | Belarus | 99.6 /100 | #48 | Exceptional 12.0% |
| Immigrants | Egypt | 99.6 /100 | #49 | Exceptional 12.0% |
| Immigrants | Croatia | 99.6 /100 | #50 | Exceptional 12.0% |
| Paraguayans | 99.6 /100 | #51 | Exceptional 12.0% |
| Immigrants | Eastern Europe | 99.6 /100 | #52 | Exceptional 12.0% |
| Immigrants | Israel | 99.6 /100 | #53 | Exceptional 12.0% |
| Eastern Europeans | 99.6 /100 | #54 | Exceptional 12.0% |
| Immigrants | Philippines | 99.5 /100 | #55 | Exceptional 12.0% |
| Luxembourgers | 99.5 /100 | #56 | Exceptional 12.1% |