Immigrants from Singapore vs Indonesian Single Female Poverty
COMPARE
Immigrants from Singapore
Indonesian
Single Female Poverty
Single Female Poverty Comparison
Immigrants from Singapore
Indonesians
18.3%
SINGLE FEMALE POVERTY
100.0/ 100
METRIC RATING
25th/ 347
METRIC RANK
24.3%
SINGLE FEMALE POVERTY
0.0/ 100
METRIC RATING
290th/ 347
METRIC RANK
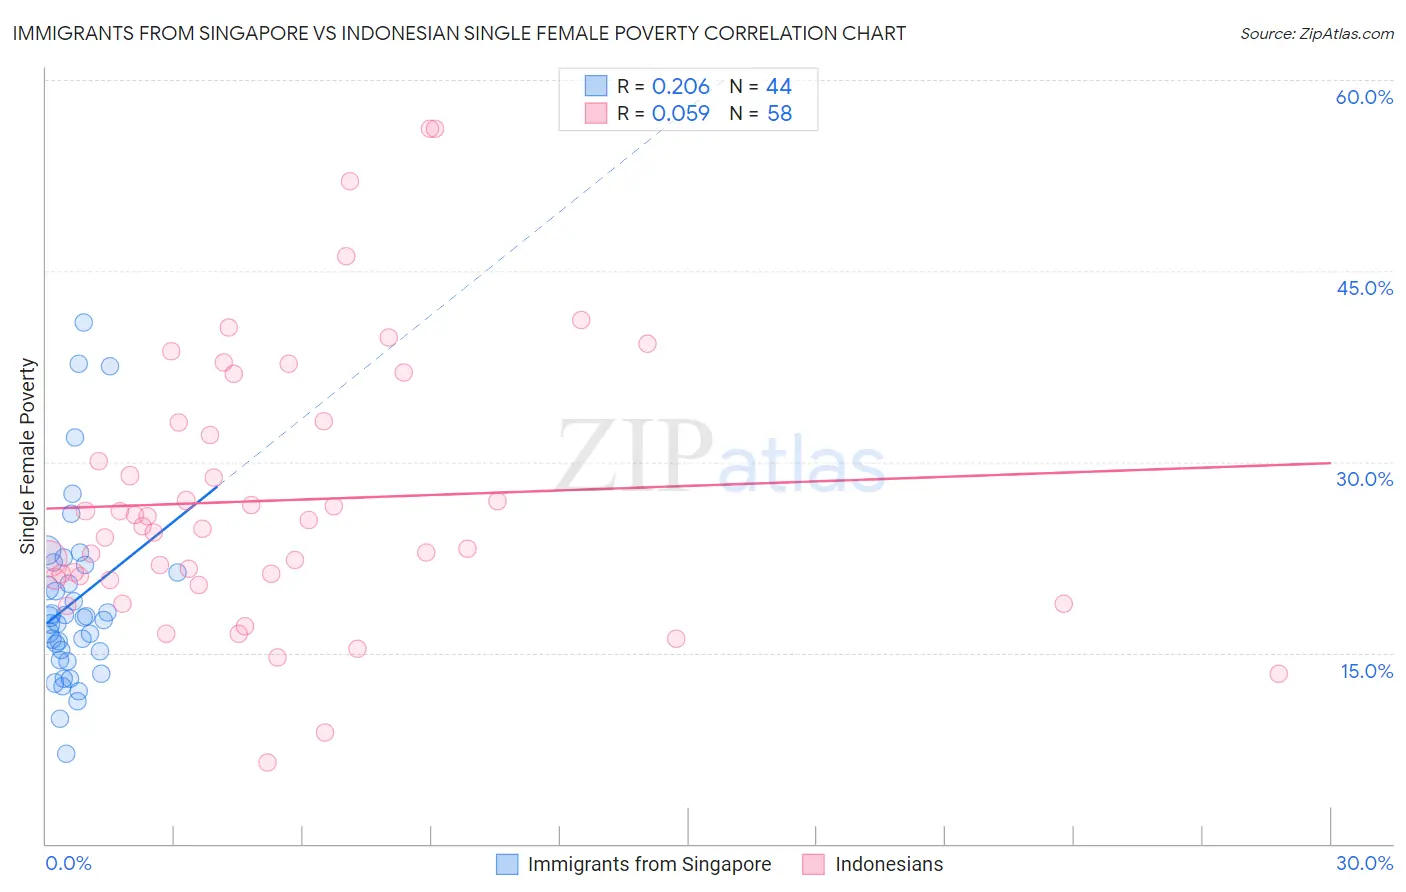
Immigrants from Singapore vs Indonesian Single Female Poverty Correlation Chart
The statistical analysis conducted on geographies consisting of 136,295,396 people shows a weak positive correlation between the proportion of Immigrants from Singapore and poverty level among single females in the United States with a correlation coefficient (R) of 0.206 and weighted average of 18.3%. Similarly, the statistical analysis conducted on geographies consisting of 161,765,451 people shows a slight positive correlation between the proportion of Indonesians and poverty level among single females in the United States with a correlation coefficient (R) of 0.059 and weighted average of 24.3%, a difference of 32.3%.
Single Female Poverty Correlation Summary
| Measurement | Immigrants from Singapore | Indonesian |
| Minimum | 7.1% | 6.4% |
| Maximum | 41.0% | 56.2% |
| Range | 33.9% | 49.8% |
| Mean | 19.0% | 27.0% |
| Median | 17.7% | 24.8% |
| Interquartile 25% (IQ1) | 14.8% | 20.8% |
| Interquartile 75% (IQ3) | 21.6% | 33.1% |
| Interquartile Range (IQR) | 6.8% | 12.3% |
| Standard Deviation (Sample) | 7.2% | 10.6% |
| Standard Deviation (Population) | 7.1% | 10.5% |
Similar Demographics by Single Female Poverty
Demographics Similar to Immigrants from Singapore by Single Female Poverty
In terms of single female poverty, the demographic groups most similar to Immigrants from Singapore are Immigrants from Israel (18.3%, a difference of 0.020%), Armenian (18.3%, a difference of 0.10%), Burmese (18.3%, a difference of 0.33%), Asian (18.3%, a difference of 0.33%), and Maltese (18.3%, a difference of 0.34%).
| Demographics | Rating | Rank | Single Female Poverty |
| Immigrants | Eastern Asia | 100.0 /100 | #18 | Exceptional 18.1% |
| Immigrants | China | 100.0 /100 | #19 | Exceptional 18.1% |
| Immigrants | Greece | 100.0 /100 | #20 | Exceptional 18.3% |
| Maltese | 100.0 /100 | #21 | Exceptional 18.3% |
| Burmese | 100.0 /100 | #22 | Exceptional 18.3% |
| Asians | 100.0 /100 | #23 | Exceptional 18.3% |
| Armenians | 100.0 /100 | #24 | Exceptional 18.3% |
| Immigrants | Singapore | 100.0 /100 | #25 | Exceptional 18.3% |
| Immigrants | Israel | 100.0 /100 | #26 | Exceptional 18.3% |
| Immigrants | Pakistan | 100.0 /100 | #27 | Exceptional 18.4% |
| Immigrants | Moldova | 100.0 /100 | #28 | Exceptional 18.5% |
| Immigrants | Poland | 100.0 /100 | #29 | Exceptional 18.5% |
| Immigrants | North Macedonia | 99.9 /100 | #30 | Exceptional 18.5% |
| Immigrants | Asia | 99.9 /100 | #31 | Exceptional 18.6% |
| Immigrants | Sri Lanka | 99.9 /100 | #32 | Exceptional 18.6% |
Demographics Similar to Indonesians by Single Female Poverty
In terms of single female poverty, the demographic groups most similar to Indonesians are U.S. Virgin Islander (24.2%, a difference of 0.34%), Spanish American (24.2%, a difference of 0.40%), Bangladeshi (24.2%, a difference of 0.41%), Cree (24.1%, a difference of 0.57%), and Immigrants from Guatemala (24.1%, a difference of 0.60%).
| Demographics | Rating | Rank | Single Female Poverty |
| German Russians | 0.0 /100 | #283 | Tragic 23.9% |
| Immigrants | Dominica | 0.0 /100 | #284 | Tragic 23.9% |
| Immigrants | Guatemala | 0.0 /100 | #285 | Tragic 24.1% |
| Cree | 0.0 /100 | #286 | Tragic 24.1% |
| Bangladeshis | 0.0 /100 | #287 | Tragic 24.2% |
| Spanish Americans | 0.0 /100 | #288 | Tragic 24.2% |
| U.S. Virgin Islanders | 0.0 /100 | #289 | Tragic 24.2% |
| Indonesians | 0.0 /100 | #290 | Tragic 24.3% |
| Osage | 0.0 /100 | #291 | Tragic 24.4% |
| Alsatians | 0.0 /100 | #292 | Tragic 24.5% |
| Americans | 0.0 /100 | #293 | Tragic 24.5% |
| French American Indians | 0.0 /100 | #294 | Tragic 24.6% |
| Hispanics or Latinos | 0.0 /100 | #295 | Tragic 24.6% |
| Africans | 0.0 /100 | #296 | Tragic 24.8% |
| Immigrants | Central America | 0.0 /100 | #297 | Tragic 24.8% |