Filipino vs Bermudan In Labor Force | Age > 16
COMPARE
Filipino
Bermudan
In Labor Force | Age > 16
In Labor Force | Age > 16 Comparison
Filipinos
Bermudans
65.9%
IN LABOR FORCE | AGE > 16
98.9/ 100
METRIC RATING
97th/ 347
METRIC RANK
66.0%
IN LABOR FORCE | AGE > 16
99.3/ 100
METRIC RATING
88th/ 347
METRIC RANK
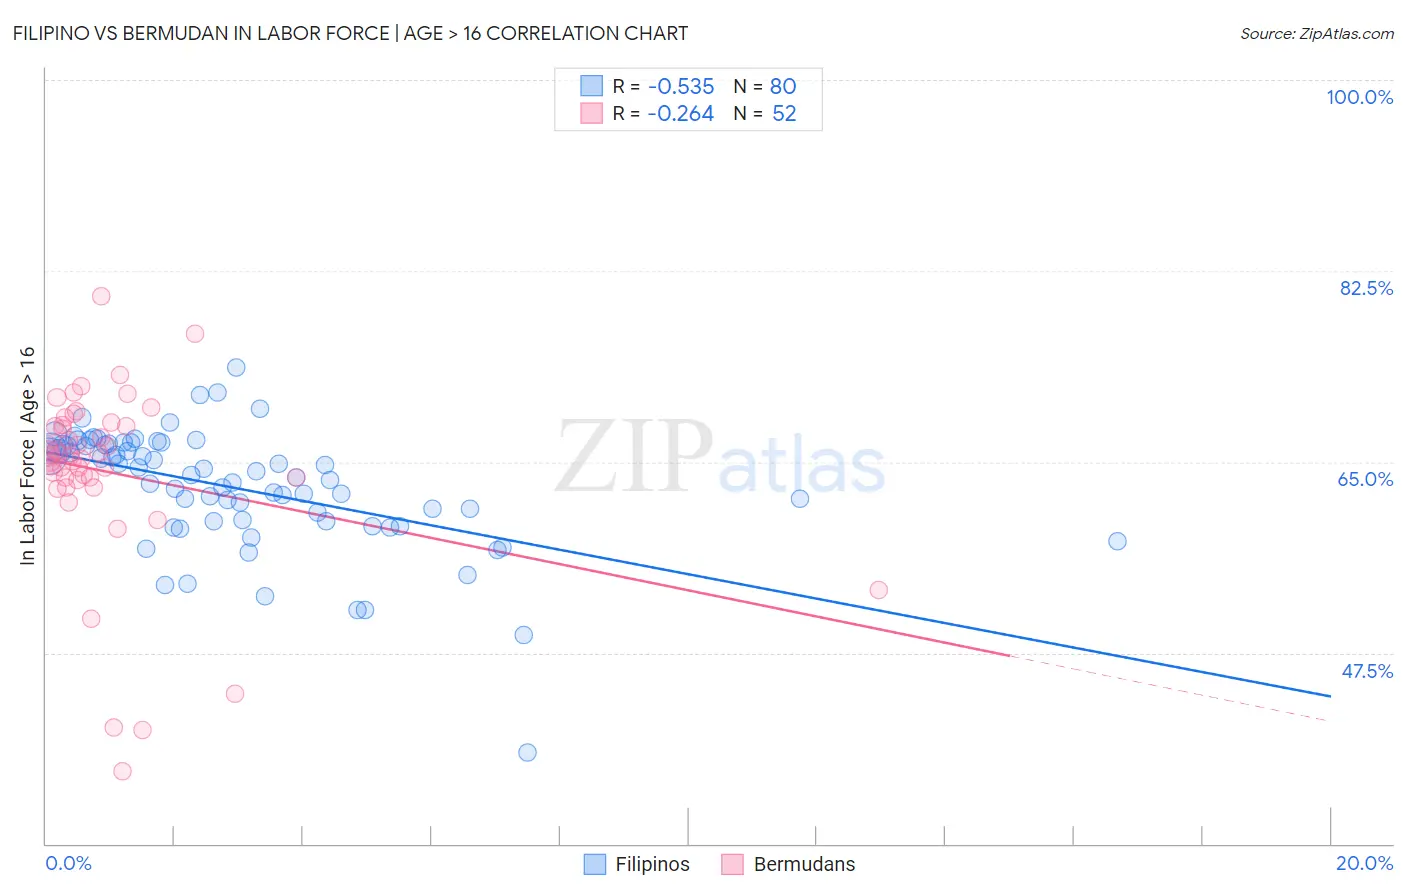
Filipino vs Bermudan In Labor Force | Age > 16 Correlation Chart
The statistical analysis conducted on geographies consisting of 254,350,604 people shows a substantial negative correlation between the proportion of Filipinos and labor force participation rate among population ages 16 and over in the United States with a correlation coefficient (R) of -0.535 and weighted average of 65.9%. Similarly, the statistical analysis conducted on geographies consisting of 55,730,379 people shows a weak negative correlation between the proportion of Bermudans and labor force participation rate among population ages 16 and over in the United States with a correlation coefficient (R) of -0.264 and weighted average of 66.0%, a difference of 0.15%.
In Labor Force | Age > 16 Correlation Summary
| Measurement | Filipino | Bermudan |
| Minimum | 38.4% | 36.6% |
| Maximum | 73.7% | 80.2% |
| Range | 35.3% | 43.6% |
| Mean | 62.6% | 64.1% |
| Median | 63.7% | 65.6% |
| Interquartile 25% (IQ1) | 59.6% | 63.4% |
| Interquartile 75% (IQ3) | 66.6% | 68.3% |
| Interquartile Range (IQR) | 7.0% | 4.9% |
| Standard Deviation (Sample) | 5.6% | 8.4% |
| Standard Deviation (Population) | 5.5% | 8.3% |
Demographics Similar to Filipinos and Bermudans by In Labor Force | Age > 16
In terms of in labor force | age > 16, the demographic groups most similar to Filipinos are Bangladeshi (65.9%, a difference of 0.010%), Immigrants from Chile (65.9%, a difference of 0.030%), Immigrants from Cambodia (66.0%, a difference of 0.050%), Immigrants from Uruguay (66.0%, a difference of 0.050%), and Immigrants from Australia (65.9%, a difference of 0.050%). Similarly, the demographic groups most similar to Bermudans are South American Indian (66.0%, a difference of 0.0%), South American (66.0%, a difference of 0.010%), Mongolian (66.1%, a difference of 0.030%), Immigrants from Jordan (66.1%, a difference of 0.040%), and Central American (66.1%, a difference of 0.040%).
| Demographics | Rating | Rank | In Labor Force | Age > 16 |
| German Russians | 99.4 /100 | #82 | Exceptional 66.1% |
| Immigrants | Jordan | 99.4 /100 | #83 | Exceptional 66.1% |
| Central Americans | 99.4 /100 | #84 | Exceptional 66.1% |
| Mongolians | 99.4 /100 | #85 | Exceptional 66.1% |
| South Americans | 99.4 /100 | #86 | Exceptional 66.0% |
| South American Indians | 99.4 /100 | #87 | Exceptional 66.0% |
| Bermudans | 99.3 /100 | #88 | Exceptional 66.0% |
| Immigrants | Laos | 99.2 /100 | #89 | Exceptional 66.0% |
| Chileans | 99.2 /100 | #90 | Exceptional 66.0% |
| Iranians | 99.2 /100 | #91 | Exceptional 66.0% |
| Aleuts | 99.1 /100 | #92 | Exceptional 66.0% |
| Immigrants | South America | 99.1 /100 | #93 | Exceptional 66.0% |
| Immigrants | Cambodia | 99.1 /100 | #94 | Exceptional 66.0% |
| Immigrants | Uruguay | 99.1 /100 | #95 | Exceptional 66.0% |
| Bangladeshis | 98.9 /100 | #96 | Exceptional 65.9% |
| Filipinos | 98.9 /100 | #97 | Exceptional 65.9% |
| Immigrants | Chile | 98.7 /100 | #98 | Exceptional 65.9% |
| Immigrants | Australia | 98.7 /100 | #99 | Exceptional 65.9% |
| Okinawans | 98.7 /100 | #100 | Exceptional 65.9% |
| Immigrants | Colombia | 98.6 /100 | #101 | Exceptional 65.9% |
| Uruguayans | 98.6 /100 | #102 | Exceptional 65.9% |