Fijian vs Immigrants from Nicaragua Unemployment Among Seniors over 75 years
COMPARE
Fijian
Immigrants from Nicaragua
Unemployment Among Seniors over 75 years
Unemployment Among Seniors over 75 years Comparison
Fijians
Immigrants from Nicaragua
8.7%
UNEMPLOYMENT AMONG SENIORS OVER 75 YEARS
56.4/ 100
METRIC RATING
169th/ 347
METRIC RANK
7.9%
UNEMPLOYMENT AMONG SENIORS OVER 75 YEARS
99.9/ 100
METRIC RATING
63rd/ 347
METRIC RANK
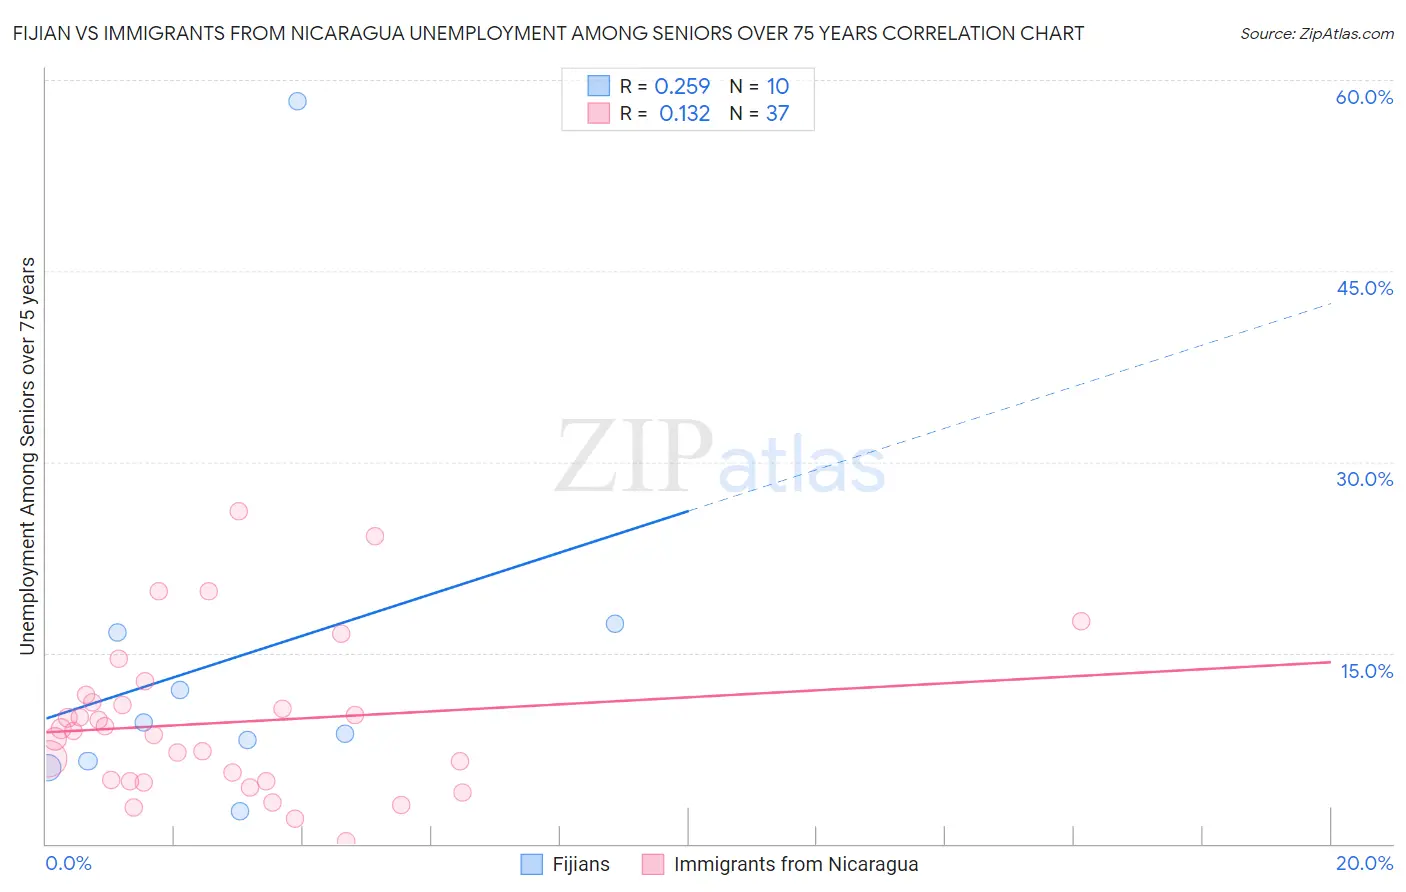
Fijian vs Immigrants from Nicaragua Unemployment Among Seniors over 75 years Correlation Chart
The statistical analysis conducted on geographies consisting of 43,656,778 people shows a weak positive correlation between the proportion of Fijians and unemployment rate among seniors over the age of 75 in the United States with a correlation coefficient (R) of 0.259 and weighted average of 8.7%. Similarly, the statistical analysis conducted on geographies consisting of 145,789,303 people shows a poor positive correlation between the proportion of Immigrants from Nicaragua and unemployment rate among seniors over the age of 75 in the United States with a correlation coefficient (R) of 0.132 and weighted average of 7.9%, a difference of 9.9%.
Unemployment Among Seniors over 75 years Correlation Summary
| Measurement | Fijian | Immigrants from Nicaragua |
| Minimum | 2.6% | 0.20% |
| Maximum | 58.3% | 26.1% |
| Range | 55.7% | 25.9% |
| Mean | 14.6% | 9.5% |
| Median | 9.1% | 8.9% |
| Interquartile 25% (IQ1) | 6.5% | 4.9% |
| Interquartile 75% (IQ3) | 16.6% | 11.4% |
| Interquartile Range (IQR) | 10.2% | 6.5% |
| Standard Deviation (Sample) | 16.0% | 6.1% |
| Standard Deviation (Population) | 15.2% | 6.0% |
Similar Demographics by Unemployment Among Seniors over 75 years
Demographics Similar to Fijians by Unemployment Among Seniors over 75 years
In terms of unemployment among seniors over 75 years, the demographic groups most similar to Fijians are Immigrants from Lithuania (8.7%, a difference of 0.040%), Immigrants from Eastern Africa (8.7%, a difference of 0.060%), Immigrants from Belize (8.7%, a difference of 0.070%), Zimbabwean (8.7%, a difference of 0.13%), and Dominican (8.7%, a difference of 0.25%).
| Demographics | Rating | Rank | Unemployment Among Seniors over 75 years |
| Immigrants | South America | 71.3 /100 | #162 | Good 8.6% |
| Immigrants | Guatemala | 68.4 /100 | #163 | Good 8.7% |
| Paraguayans | 62.2 /100 | #164 | Good 8.7% |
| Immigrants | Dominican Republic | 61.4 /100 | #165 | Good 8.7% |
| Immigrants | Belize | 57.6 /100 | #166 | Average 8.7% |
| Immigrants | Eastern Africa | 57.6 /100 | #167 | Average 8.7% |
| Immigrants | Lithuania | 57.2 /100 | #168 | Average 8.7% |
| Fijians | 56.4 /100 | #169 | Average 8.7% |
| Zimbabweans | 54.1 /100 | #170 | Average 8.7% |
| Dominicans | 51.9 /100 | #171 | Average 8.7% |
| Immigrants | Immigrants | 51.8 /100 | #172 | Average 8.7% |
| Australians | 50.3 /100 | #173 | Average 8.7% |
| Immigrants | El Salvador | 49.7 /100 | #174 | Average 8.7% |
| Syrians | 49.6 /100 | #175 | Average 8.7% |
| Somalis | 45.3 /100 | #176 | Average 8.8% |
Demographics Similar to Immigrants from Nicaragua by Unemployment Among Seniors over 75 years
In terms of unemployment among seniors over 75 years, the demographic groups most similar to Immigrants from Nicaragua are Immigrants from Taiwan (7.9%, a difference of 0.060%), Immigrants from Albania (7.9%, a difference of 0.070%), Uruguayan (7.9%, a difference of 0.10%), Argentinean (7.9%, a difference of 0.12%), and Immigrants from Morocco (7.9%, a difference of 0.14%).
| Demographics | Rating | Rank | Unemployment Among Seniors over 75 years |
| Immigrants | Eastern Asia | 99.9 /100 | #56 | Exceptional 7.9% |
| Ottawa | 99.9 /100 | #57 | Exceptional 7.9% |
| Iranians | 99.9 /100 | #58 | Exceptional 7.9% |
| Indonesians | 99.9 /100 | #59 | Exceptional 7.9% |
| Immigrants | Morocco | 99.9 /100 | #60 | Exceptional 7.9% |
| Uruguayans | 99.9 /100 | #61 | Exceptional 7.9% |
| Immigrants | Albania | 99.9 /100 | #62 | Exceptional 7.9% |
| Immigrants | Nicaragua | 99.9 /100 | #63 | Exceptional 7.9% |
| Immigrants | Taiwan | 99.9 /100 | #64 | Exceptional 7.9% |
| Argentineans | 99.9 /100 | #65 | Exceptional 7.9% |
| Immigrants | Austria | 99.9 /100 | #66 | Exceptional 8.0% |
| Immigrants | Syria | 99.9 /100 | #67 | Exceptional 8.0% |
| Immigrants | South Africa | 99.9 /100 | #68 | Exceptional 8.0% |
| Indians (Asian) | 99.9 /100 | #69 | Exceptional 8.0% |
| Immigrants | Argentina | 99.9 /100 | #70 | Exceptional 8.0% |