Hmong vs Immigrants from Nicaragua Male Poverty
COMPARE
Hmong
Immigrants from Nicaragua
Male Poverty
Male Poverty Comparison
Hmong
Immigrants from Nicaragua
11.6%
MALE POVERTY
15.8/ 100
METRIC RATING
196th/ 347
METRIC RANK
12.9%
MALE POVERTY
0.2/ 100
METRIC RATING
250th/ 347
METRIC RANK
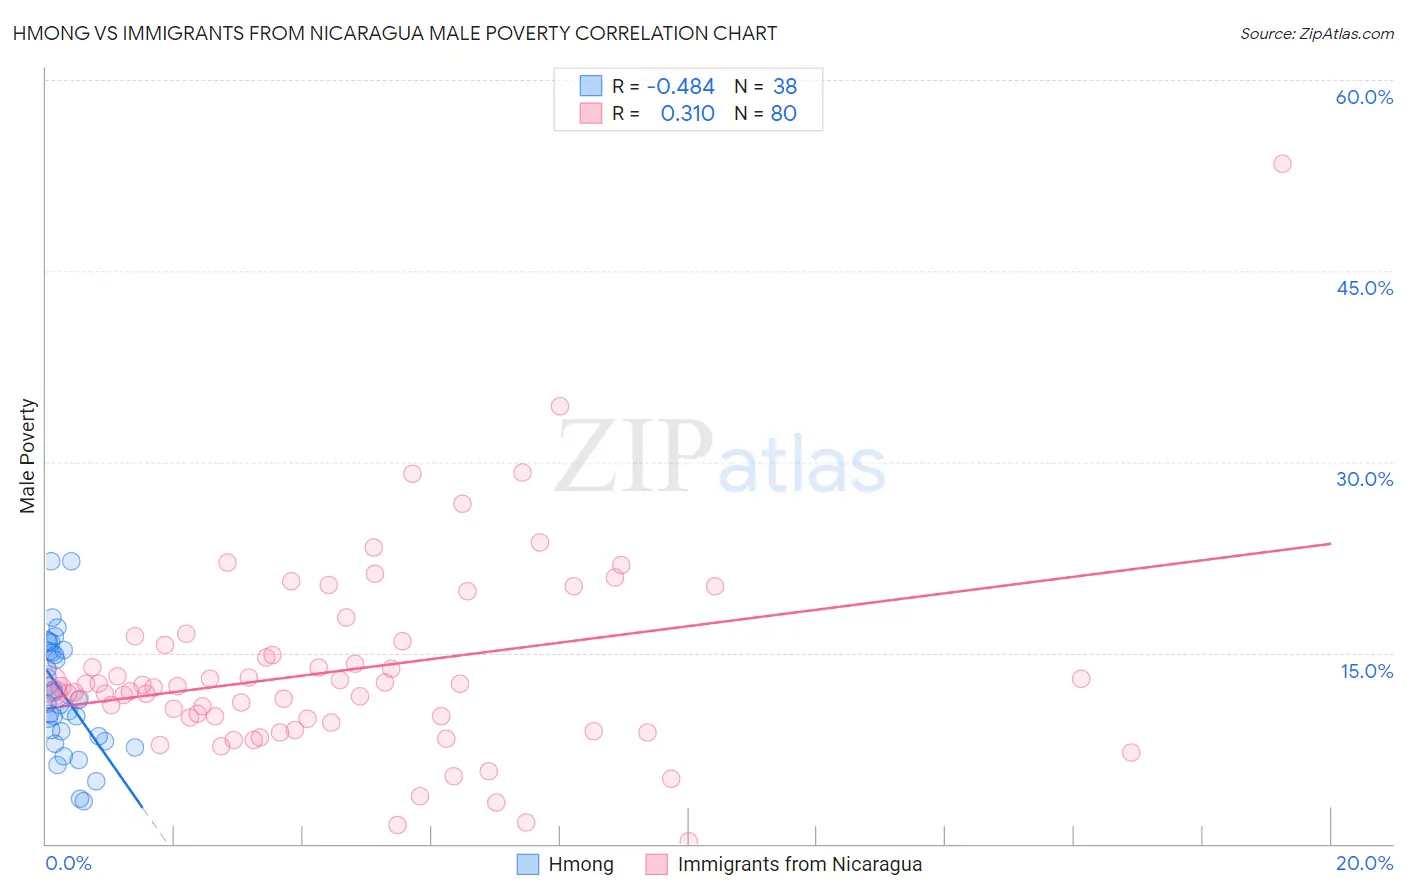
Hmong vs Immigrants from Nicaragua Male Poverty Correlation Chart
The statistical analysis conducted on geographies consisting of 24,672,093 people shows a moderate negative correlation between the proportion of Hmong and poverty level among males in the United States with a correlation coefficient (R) of -0.484 and weighted average of 11.6%. Similarly, the statistical analysis conducted on geographies consisting of 236,310,825 people shows a mild positive correlation between the proportion of Immigrants from Nicaragua and poverty level among males in the United States with a correlation coefficient (R) of 0.310 and weighted average of 12.9%, a difference of 10.8%.
Male Poverty Correlation Summary
| Measurement | Hmong | Immigrants from Nicaragua |
| Minimum | 3.4% | 0.19% |
| Maximum | 22.2% | 53.4% |
| Range | 18.8% | 53.2% |
| Mean | 11.7% | 13.6% |
| Median | 11.1% | 12.3% |
| Interquartile 25% (IQ1) | 8.4% | 9.7% |
| Interquartile 75% (IQ3) | 15.1% | 15.8% |
| Interquartile Range (IQR) | 6.7% | 6.1% |
| Standard Deviation (Sample) | 4.5% | 7.7% |
| Standard Deviation (Population) | 4.5% | 7.7% |
Similar Demographics by Male Poverty
Demographics Similar to Hmong by Male Poverty
In terms of male poverty, the demographic groups most similar to Hmong are Arab (11.6%, a difference of 0.010%), Immigrants from Kenya (11.6%, a difference of 0.050%), Delaware (11.7%, a difference of 0.060%), Iraqi (11.7%, a difference of 0.20%), and Immigrants from Kuwait (11.6%, a difference of 0.27%).
| Demographics | Rating | Rank | Male Poverty |
| Hawaiians | 28.3 /100 | #189 | Fair 11.4% |
| Israelis | 26.1 /100 | #190 | Fair 11.5% |
| South American Indians | 22.8 /100 | #191 | Fair 11.5% |
| Immigrants | Uruguay | 19.1 /100 | #192 | Poor 11.6% |
| Immigrants | Kuwait | 17.3 /100 | #193 | Poor 11.6% |
| Immigrants | Kenya | 16.1 /100 | #194 | Poor 11.6% |
| Arabs | 15.8 /100 | #195 | Poor 11.6% |
| Hmong | 15.8 /100 | #196 | Poor 11.6% |
| Delaware | 15.4 /100 | #197 | Poor 11.7% |
| Iraqis | 14.7 /100 | #198 | Poor 11.7% |
| Spanish | 14.1 /100 | #199 | Poor 11.7% |
| Immigrants | Lebanon | 13.6 /100 | #200 | Poor 11.7% |
| Spaniards | 13.5 /100 | #201 | Poor 11.7% |
| Aleuts | 10.4 /100 | #202 | Poor 11.8% |
| Immigrants | Western Asia | 9.8 /100 | #203 | Tragic 11.8% |
Demographics Similar to Immigrants from Nicaragua by Male Poverty
In terms of male poverty, the demographic groups most similar to Immigrants from Nicaragua are Potawatomi (12.9%, a difference of 0.010%), Immigrants from Sudan (12.9%, a difference of 0.080%), Immigrants from Cuba (12.9%, a difference of 0.10%), Immigrants from Ecuador (12.9%, a difference of 0.13%), and Immigrants from Western Africa (12.9%, a difference of 0.14%).
| Demographics | Rating | Rank | Male Poverty |
| Alaskan Athabascans | 0.3 /100 | #243 | Tragic 12.8% |
| Tsimshian | 0.3 /100 | #244 | Tragic 12.8% |
| Liberians | 0.3 /100 | #245 | Tragic 12.8% |
| Immigrants | El Salvador | 0.2 /100 | #246 | Tragic 12.8% |
| Immigrants | Western Africa | 0.2 /100 | #247 | Tragic 12.9% |
| Immigrants | Sudan | 0.2 /100 | #248 | Tragic 12.9% |
| Potawatomi | 0.2 /100 | #249 | Tragic 12.9% |
| Immigrants | Nicaragua | 0.2 /100 | #250 | Tragic 12.9% |
| Immigrants | Cuba | 0.2 /100 | #251 | Tragic 12.9% |
| Immigrants | Ecuador | 0.2 /100 | #252 | Tragic 12.9% |
| Immigrants | Ghana | 0.2 /100 | #253 | Tragic 12.9% |
| Mexican American Indians | 0.1 /100 | #254 | Tragic 13.0% |
| Immigrants | Liberia | 0.1 /100 | #255 | Tragic 13.0% |
| Immigrants | Burma/Myanmar | 0.1 /100 | #256 | Tragic 13.0% |
| Immigrants | Trinidad and Tobago | 0.1 /100 | #257 | Tragic 13.1% |