Ecuadorian vs Canadian Receiving Food Stamps
COMPARE
Ecuadorian
Canadian
Receiving Food Stamps
Receiving Food Stamps Comparison
Ecuadorians
Canadians
14.9%
RECEIVING FOOD STAMPS
0.0/ 100
METRIC RATING
280th/ 347
METRIC RANK
10.5%
RECEIVING FOOD STAMPS
94.8/ 100
METRIC RATING
116th/ 347
METRIC RANK
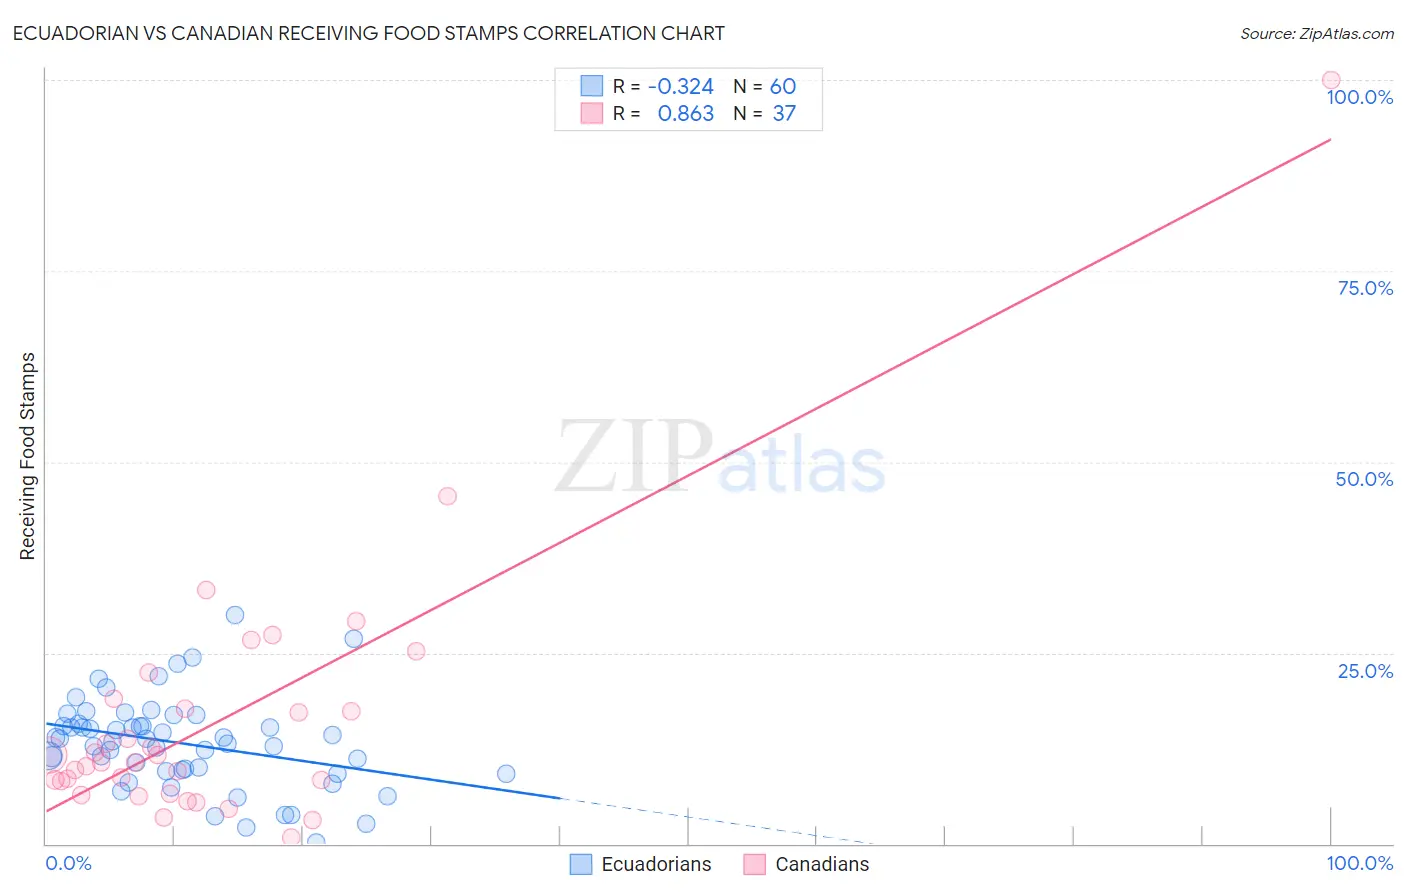
Ecuadorian vs Canadian Receiving Food Stamps Correlation Chart
The statistical analysis conducted on geographies consisting of 317,062,012 people shows a mild negative correlation between the proportion of Ecuadorians and percentage of population receiving government assistance and/or food stamps in the United States with a correlation coefficient (R) of -0.324 and weighted average of 14.9%. Similarly, the statistical analysis conducted on geographies consisting of 436,119,320 people shows a very strong positive correlation between the proportion of Canadians and percentage of population receiving government assistance and/or food stamps in the United States with a correlation coefficient (R) of 0.863 and weighted average of 10.5%, a difference of 41.1%.
Receiving Food Stamps Correlation Summary
| Measurement | Ecuadorian | Canadian |
| Minimum | 0.20% | 0.80% |
| Maximum | 30.0% | 100.0% |
| Range | 29.8% | 99.2% |
| Mean | 13.1% | 15.9% |
| Median | 13.6% | 10.7% |
| Interquartile 25% (IQ1) | 9.6% | 7.4% |
| Interquartile 75% (IQ3) | 15.6% | 18.4% |
| Interquartile Range (IQR) | 6.0% | 11.0% |
| Standard Deviation (Sample) | 5.9% | 17.1% |
| Standard Deviation (Population) | 5.9% | 16.9% |
Similar Demographics by Receiving Food Stamps
Demographics Similar to Ecuadorians by Receiving Food Stamps
In terms of receiving food stamps, the demographic groups most similar to Ecuadorians are Kiowa (14.9%, a difference of 0.050%), Belizean (14.8%, a difference of 0.32%), Spanish American Indian (14.9%, a difference of 0.32%), Seminole (14.8%, a difference of 0.45%), and Liberian (14.8%, a difference of 0.50%).
| Demographics | Rating | Rank | Receiving Food Stamps |
| Alaskan Athabascans | 0.1 /100 | #273 | Tragic 14.7% |
| Immigrants | Western Africa | 0.1 /100 | #274 | Tragic 14.7% |
| Ute | 0.1 /100 | #275 | Tragic 14.7% |
| Liberians | 0.1 /100 | #276 | Tragic 14.8% |
| Seminole | 0.1 /100 | #277 | Tragic 14.8% |
| Belizeans | 0.1 /100 | #278 | Tragic 14.8% |
| Kiowa | 0.0 /100 | #279 | Tragic 14.9% |
| Ecuadorians | 0.0 /100 | #280 | Tragic 14.9% |
| Spanish American Indians | 0.0 /100 | #281 | Tragic 14.9% |
| Immigrants | Central America | 0.0 /100 | #282 | Tragic 15.0% |
| Bangladeshis | 0.0 /100 | #283 | Tragic 15.0% |
| Immigrants | Ecuador | 0.0 /100 | #284 | Tragic 15.0% |
| Immigrants | Liberia | 0.0 /100 | #285 | Tragic 15.1% |
| Africans | 0.0 /100 | #286 | Tragic 15.1% |
| Immigrants | Mexico | 0.0 /100 | #287 | Tragic 15.2% |
Demographics Similar to Canadians by Receiving Food Stamps
In terms of receiving food stamps, the demographic groups most similar to Canadians are Immigrants from Saudi Arabia (10.5%, a difference of 0.050%), Immigrants from Nepal (10.6%, a difference of 0.16%), Scotch-Irish (10.5%, a difference of 0.22%), Assyrian/Chaldean/Syriac (10.6%, a difference of 0.50%), and Icelander (10.5%, a difference of 0.52%).
| Demographics | Rating | Rank | Receiving Food Stamps |
| Immigrants | Pakistan | 96.2 /100 | #109 | Exceptional 10.4% |
| Pakistanis | 95.9 /100 | #110 | Exceptional 10.4% |
| Romanians | 95.8 /100 | #111 | Exceptional 10.4% |
| Mongolians | 95.8 /100 | #112 | Exceptional 10.5% |
| Icelanders | 95.4 /100 | #113 | Exceptional 10.5% |
| Scotch-Irish | 95.1 /100 | #114 | Exceptional 10.5% |
| Immigrants | Saudi Arabia | 94.9 /100 | #115 | Exceptional 10.5% |
| Canadians | 94.8 /100 | #116 | Exceptional 10.5% |
| Immigrants | Nepal | 94.6 /100 | #117 | Exceptional 10.6% |
| Assyrians/Chaldeans/Syriacs | 94.1 /100 | #118 | Exceptional 10.6% |
| Immigrants | Poland | 93.9 /100 | #119 | Exceptional 10.6% |
| Ethiopians | 93.9 /100 | #120 | Exceptional 10.6% |
| Slavs | 93.8 /100 | #121 | Exceptional 10.6% |
| Sri Lankans | 93.7 /100 | #122 | Exceptional 10.6% |
| Immigrants | Philippines | 93.3 /100 | #123 | Exceptional 10.7% |