Ethiopian vs Korean Single Mother Poverty

COMPARE

Ethiopian
Race
Ancestry
AfghanAfricanAlaska NativeAlaskan AthabascanAlbanianAleutAlsatianAmericanApacheArabArapahoArgentineanArmenianAssyrian/Chaldean/SyriacAustralianAustrianBahamianBangladeshiBarbadianBasqueBelgianBelizeanBermudanBhutaneseBlackfeetBolivianBrazilianBritishBritish West IndianBulgarianBurmeseCajunCambodianCanadianCape VerdeanCarpatho RusynCelticCentral AmericanCentral American IndianCherokeeCheyenneChickasawChileanChineseChippewaChoctawColombianColvilleComancheCosta RicanCreeCreekCroatianCrowCubanCypriotCzechCzechoslovakianDanishDelawareDominicanDutchDutch West IndianEastern EuropeanEcuadorianEgyptianEnglishEstonianEthiopianEuropeanFijianFilipinoFinnishFrenchFrench American IndianFrench CanadianGermanGerman RussianGhanaianGreekGuamanian/ChamorroGuatemalanGuyaneseHaitianHmongHonduranHopiHoumaHungarianIcelanderIndian (Asian)IndonesianInupiatIranianIraqiIrishIroquoisIsraeliItalianJamaicanJapaneseJordanianKenyanKiowaLaotianLatvianLebaneseLiberianLithuanianLumbeeLuxembourgerMacedonianMalaysianMalteseMarshalleseMenomineeMexicanMexican American IndianMongolianMoroccanNative HawaiianNavajoNepaleseNew ZealanderNicaraguanNigerianNorthern EuropeanNorwegianOkinawanOsageOttawaPaiutePakistaniPalestinianPanamanianParaguayanPennsylvania GermanPeruvianPimaPolishPortuguesePotawatomiPuebloPuerto RicanPuget Sound SalishRomanianRussianSalvadoranSamoanScandinavianScotch-IrishScottishSeminoleSenegaleseSerbianShoshoneSierra LeoneanSiouxSlavicSlovakSloveneSomaliSouth AfricanSouth AmericanSouth American IndianSoviet UnionSpaniardSpanishSpanish AmericanSpanish American IndianSri LankanSubsaharan AfricanSudaneseSwedishSwissSyrianTaiwaneseThaiTlingit-HaidaTohono O'OdhamTonganTrinidadian and TobagonianTsimshianTurkishU.S. Virgin IslanderUgandanUkrainianUruguayanUteVenezuelanVietnameseWelshWest IndianYakamaYaquiYugoslavianYumanYup'ikZimbabwean
Immigration
NonimmigrantsImmigrantsAfghanistanAfricaAlbaniaArgentinaArmeniaAsiaAustraliaAustriaBahamasBangladeshBarbadosBelarusBelgiumBelizeBoliviaBosnia and HerzegovinaBrazilBulgariaBurma/MyanmarCabo VerdeCambodiaCameroonCanadaCaribbeanCentral AmericaChileChinaColombiaCongoCosta RicaCroatiaCubaCzechoslovakiaDenmarkDominicaDominican RepublicEastern AfricaEastern AsiaEastern EuropeEcuadorEgyptEl SalvadorEnglandEritreaEthiopiaEuropeFijiFranceGermanyGhanaGreeceGrenadaGuatemalaGuyanaHaitiHondurasHong KongHungaryIndiaIndonesiaIranIraqIrelandIsraelItalyJamaicaJapanJordanKazakhstanKenyaKoreaKuwaitLaosLatin AmericaLatviaLebanonLiberiaLithuaniaMalaysiaMexicoMicronesiaMiddle AfricaMoldovaMoroccoNepalNetherlandsNicaraguaNigeriaNorth AmericaNorth MacedoniaNorthern AfricaNorthern EuropeNorwayOceaniaPakistanPanamaPeruPhilippinesPolandPortugalRomaniaRussiaSaudi ArabiaScotlandSenegalSerbiaSierra LeoneSingaporeSomaliaSouth AfricaSouth AmericaSouth Central AsiaSouth Eastern AsiaSouthern EuropeSpainSri LankaSt. Vincent and the GrenadinesSudanSwedenSwitzerlandSyriaTaiwanThailandTrinidad and TobagoTurkeyUgandaUkraineUruguayUzbekistanVenezuelaVietnamWest IndiesWestern AfricaWestern AsiaWestern EuropeYemenZaireZimbabweAzores
Korean
Race
Ancestry
AfghanAfricanAlaska NativeAlaskan AthabascanAlbanianAleutAlsatianAmericanApacheArabArapahoArgentineanArmenianAssyrian/Chaldean/SyriacAustralianAustrianBahamianBangladeshiBarbadianBasqueBelgianBelizeanBermudanBhutaneseBlackfeetBolivianBrazilianBritishBritish West IndianBulgarianBurmeseCajunCambodianCanadianCape VerdeanCarpatho RusynCelticCentral AmericanCentral American IndianCherokeeCheyenneChickasawChileanChineseChippewaChoctawColombianColvilleComancheCosta RicanCreeCreekCroatianCrowCubanCypriotCzechCzechoslovakianDanishDelawareDominicanDutchDutch West IndianEastern EuropeanEcuadorianEgyptianEnglishEstonianEuropeanFijianFilipinoFinnishFrenchFrench American IndianFrench CanadianGermanGerman RussianGhanaianGreekGuamanian/ChamorroGuatemalanGuyaneseHaitianHmongHonduranHopiHoumaHungarianIcelanderIndian (Asian)IndonesianInupiatIranianIraqiIrishIroquoisIsraeliItalianJamaicanJapaneseJordanianKenyanKiowaKoreanLaotianLatvianLebaneseLiberianLithuanianLumbeeLuxembourgerMacedonianMalaysianMalteseMarshalleseMenomineeMexicanMexican American IndianMongolianMoroccanNative HawaiianNavajoNepaleseNew ZealanderNicaraguanNigerianNorthern EuropeanNorwegianOkinawanOsageOttawaPaiutePakistaniPalestinianPanamanianParaguayanPennsylvania GermanPeruvianPimaPolishPortuguesePotawatomiPuebloPuerto RicanPuget Sound SalishRomanianRussianSalvadoranSamoanScandinavianScotch-IrishScottishSeminoleSenegaleseSerbianShoshoneSierra LeoneanSiouxSlavicSlovakSloveneSomaliSouth AfricanSouth AmericanSouth American IndianSoviet UnionSpaniardSpanishSpanish AmericanSpanish American IndianSri LankanSubsaharan AfricanSudaneseSwedishSwissSyrianTaiwaneseThaiTlingit-HaidaTohono O'OdhamTonganTrinidadian and TobagonianTsimshianTurkishU.S. Virgin IslanderUgandanUkrainianUruguayanUteVenezuelanVietnameseWelshWest IndianYakamaYaquiYugoslavianYumanYup'ikZimbabwean
Immigration
NonimmigrantsImmigrantsAfghanistanAfricaAlbaniaArgentinaArmeniaAsiaAustraliaAustriaBahamasBangladeshBarbadosBelarusBelgiumBelizeBoliviaBosnia and HerzegovinaBrazilBulgariaBurma/MyanmarCabo VerdeCambodiaCameroonCanadaCaribbeanCentral AmericaChileChinaColombiaCongoCosta RicaCroatiaCubaCzechoslovakiaDenmarkDominicaDominican RepublicEastern AfricaEastern AsiaEastern EuropeEcuadorEgyptEl SalvadorEnglandEritreaEthiopiaEuropeFijiFranceGermanyGhanaGreeceGrenadaGuatemalaGuyanaHaitiHondurasHong KongHungaryIndiaIndonesiaIranIraqIrelandIsraelItalyJamaicaJapanJordanKazakhstanKenyaKoreaKuwaitLaosLatin AmericaLatviaLebanonLiberiaLithuaniaMalaysiaMexicoMicronesiaMiddle AfricaMoldovaMoroccoNepalNetherlandsNicaraguaNigeriaNorth AmericaNorth MacedoniaNorthern AfricaNorthern EuropeNorwayOceaniaPakistanPanamaPeruPhilippinesPolandPortugalRomaniaRussiaSaudi ArabiaScotlandSenegalSerbiaSierra LeoneSingaporeSomaliaSouth AfricaSouth AmericaSouth Central AsiaSouth Eastern AsiaSouthern EuropeSpainSri LankaSt. Vincent and the GrenadinesSudanSwedenSwitzerlandSyriaTaiwanThailandTrinidad and TobagoTurkeyUgandaUkraineUruguayUzbekistanVenezuelaVietnamWest IndiesWestern AfricaWestern AsiaWestern EuropeYemenZaireZimbabweAzores
Single Mother Poverty
Income
Poverty
Unemployment
Labor Participation
Family Structure
Vehicle Availability
Education Level
Disability

Single Mother Poverty Comparison

Ethiopians

Koreans

Exceptional
Exceptional
27.7%
SINGLE MOTHER POVERTY
98.4/ 100
METRIC RATING
88th/ 347
METRIC RANK
26.4%
SINGLE MOTHER POVERTY
100.0/ 100
METRIC RATING
28th/ 347
METRIC RANK

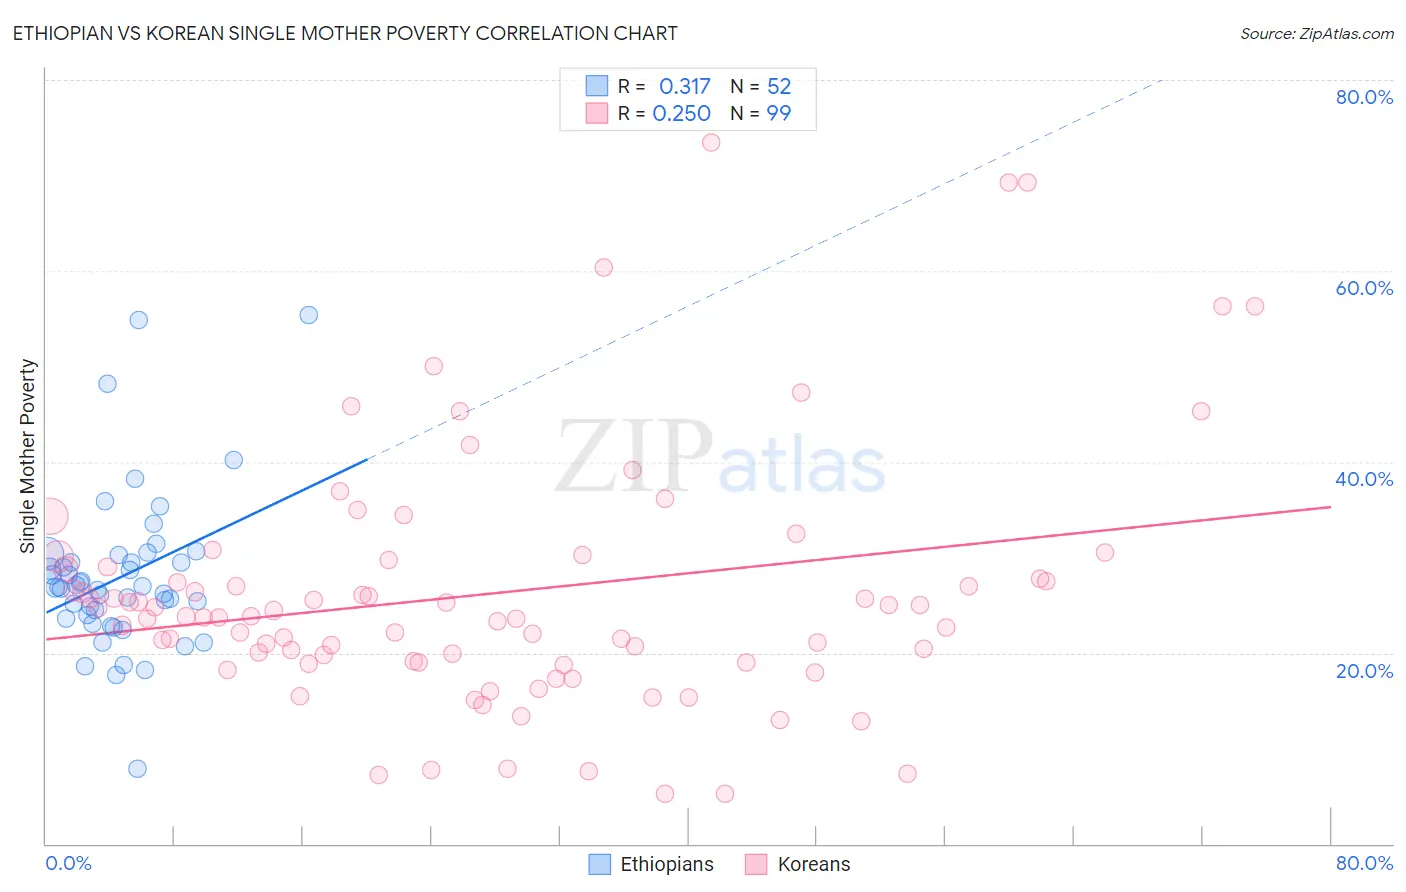
Ethiopian vs Korean Single Mother Poverty Correlation Chart

The statistical analysis conducted on geographies consisting of 220,975,245 people shows a mild positive correlation between the proportion of Ethiopians and poverty level among single mothers in the United States with a correlation coefficient (R) of 0.317 and weighted average of 27.7%. Similarly, the statistical analysis conducted on geographies consisting of 493,220,076 people shows a weak positive correlation between the proportion of Koreans and poverty level among single mothers in the United States with a correlation coefficient (R) of 0.250 and weighted average of 26.4%, a difference of 5.0%.
Ethiopian vs Korean Single Mother Poverty

Single Mother Poverty Correlation Summary

MeasurementEthiopianKorean
Minimum7.9%5.2%
Maximum55.4%73.4%
Range47.5%68.2%
Mean27.9%26.2%
Median26.9%23.8%
Interquartile 25% (IQ1)23.7%19.0%
Interquartile 75% (IQ3)29.9%29.0%
Interquartile Range (IQR)6.1%10.0%
Standard Deviation (Sample)8.3%13.2%
Standard Deviation (Population)8.2%13.1%

Similar Demographics by Single Mother Poverty

Demographics Similar to Ethiopians by Single Mother Poverty

In terms of single mother poverty, the demographic groups most similar to Ethiopians are Afghan (27.7%, a difference of 0.020%), Immigrants from Ethiopia (27.7%, a difference of 0.020%), Immigrants from Ukraine (27.7%, a difference of 0.12%), Immigrants from France (27.8%, a difference of 0.19%), and Mongolian (27.7%, a difference of 0.21%).
DemographicsRating | RankSingle Mother Poverty
Immigrants | Scotland
98.9
/100
|
#81
Exceptional
27.6%
Immigrants | Cameroon
98.8
/100
|
#82
Exceptional
27.6%
Greeks
98.7
/100
|
#83
Exceptional
27.7%
Immigrants | Latvia
98.7
/100
|
#84
Exceptional
27.7%
Mongolians
98.7
/100
|
#85
Exceptional
27.7%
Immigrants | Ukraine
98.6
/100
|
#86
Exceptional
27.7%
Afghans
98.5
/100
|
#87
Exceptional
27.7%
Ethiopians
98.4
/100
|
#88
Exceptional
27.7%
Immigrants | Ethiopia
98.4
/100
|
#89
Exceptional
27.7%
Immigrants | France
98.2
/100
|
#90
Exceptional
27.8%
Immigrants | Albania
98.0
/100
|
#91
Exceptional
27.8%
Estonians
97.9
/100
|
#92
Exceptional
27.8%
Romanians
97.8
/100
|
#93
Exceptional
27.8%
Albanians
97.6
/100
|
#94
Exceptional
27.9%
Chileans
97.5
/100
|
#95
Exceptional
27.9%

Demographics Similar to Koreans by Single Mother Poverty

In terms of single mother poverty, the demographic groups most similar to Koreans are Immigrants from Japan (26.4%, a difference of 0.010%), Jordanian (26.4%, a difference of 0.050%), Turkish (26.4%, a difference of 0.14%), Immigrants from Sri Lanka (26.3%, a difference of 0.24%), and Immigrants from Philippines (26.5%, a difference of 0.30%).
DemographicsRating | RankSingle Mother Poverty
Immigrants | Bolivia
100.0
/100
|
#21
Exceptional
26.2%
Immigrants | Korea
100.0
/100
|
#22
Exceptional
26.2%
Burmese
100.0
/100
|
#23
Exceptional
26.2%
Immigrants | Moldova
100.0
/100
|
#24
Exceptional
26.2%
Immigrants | Asia
100.0
/100
|
#25
Exceptional
26.3%
Immigrants | Sri Lanka
100.0
/100
|
#26
Exceptional
26.3%
Immigrants | Japan
100.0
/100
|
#27
Exceptional
26.4%
Koreans
100.0
/100
|
#28
Exceptional
26.4%
Jordanians
100.0
/100
|
#29
Exceptional
26.4%
Turks
100.0
/100
|
#30
Exceptional
26.4%
Immigrants | Philippines
100.0
/100
|
#31
Exceptional
26.5%
Tongans
99.9
/100
|
#32
Exceptional
26.5%
Bulgarians
99.9
/100
|
#33
Exceptional
26.5%
Immigrants | Indonesia
99.9
/100
|
#34
Exceptional
26.6%
Maltese
99.9
/100
|
#35
Exceptional
26.6%