Alaska Native vs Kenyan Child Poverty Under the Age of 5
COMPARE
Alaska Native
Kenyan
Child Poverty Under the Age of 5
Child Poverty Under the Age of 5 Comparison
Alaska Natives
Kenyans
19.6%
CHILD POVERTY UNDER THE AGE OF 5
0.5/ 100
METRIC RATING
241st/ 347
METRIC RANK
17.5%
CHILD POVERTY UNDER THE AGE OF 5
34.7/ 100
METRIC RATING
187th/ 347
METRIC RANK
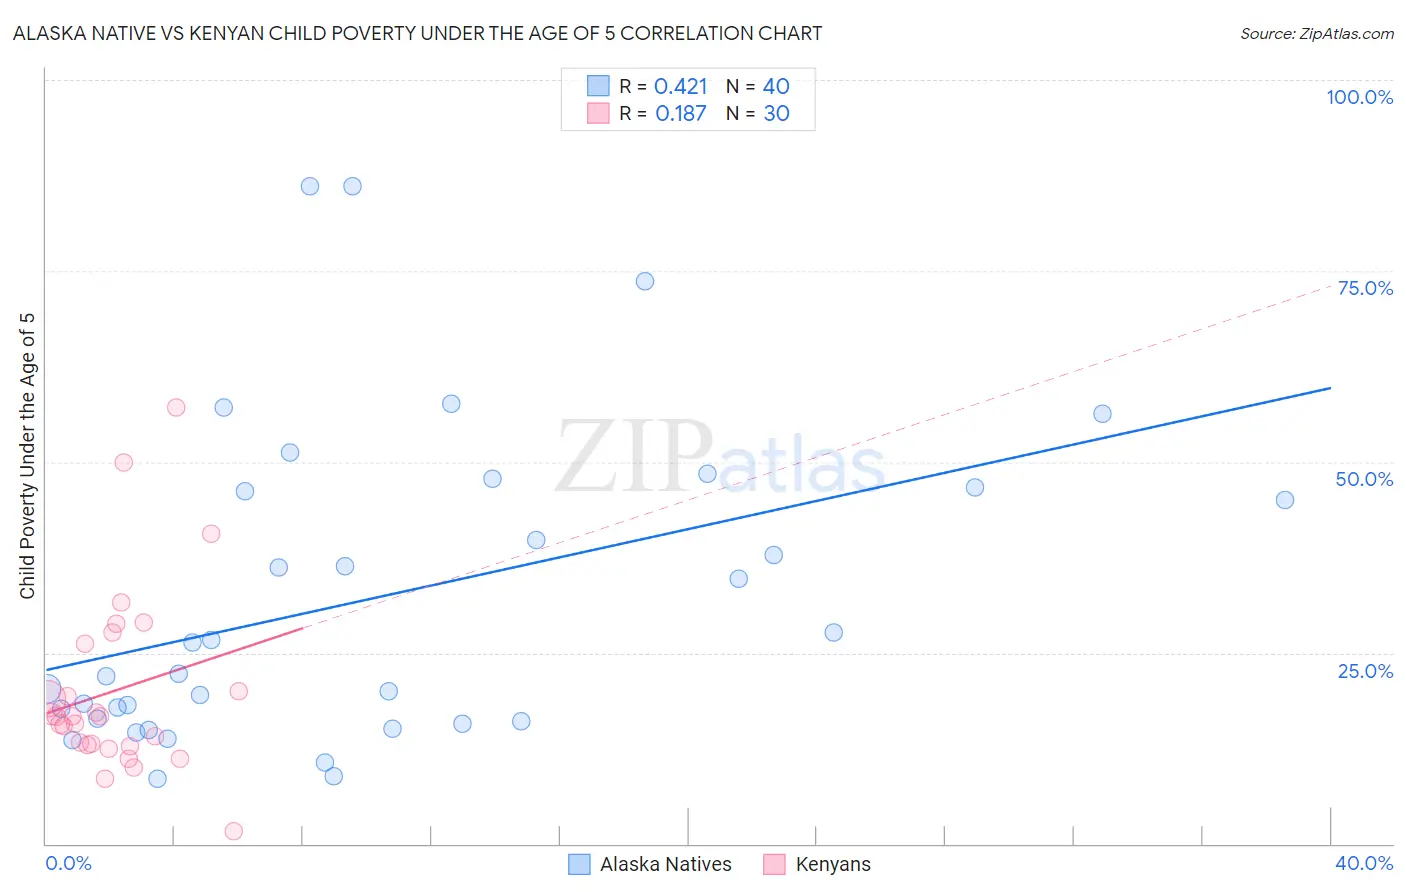
Alaska Native vs Kenyan Child Poverty Under the Age of 5 Correlation Chart
The statistical analysis conducted on geographies consisting of 76,221,903 people shows a moderate positive correlation between the proportion of Alaska Natives and poverty level among children under the age of 5 in the United States with a correlation coefficient (R) of 0.421 and weighted average of 19.6%. Similarly, the statistical analysis conducted on geographies consisting of 165,881,160 people shows a poor positive correlation between the proportion of Kenyans and poverty level among children under the age of 5 in the United States with a correlation coefficient (R) of 0.187 and weighted average of 17.5%, a difference of 11.9%.
Child Poverty Under the Age of 5 Correlation Summary
| Measurement | Alaska Native | Kenyan |
| Minimum | 8.4% | 1.7% |
| Maximum | 86.0% | 57.1% |
| Range | 77.6% | 55.4% |
| Mean | 32.3% | 20.0% |
| Median | 24.3% | 16.6% |
| Interquartile 25% (IQ1) | 16.2% | 13.0% |
| Interquartile 75% (IQ3) | 46.4% | 26.2% |
| Interquartile Range (IQR) | 30.2% | 13.2% |
| Standard Deviation (Sample) | 20.5% | 12.0% |
| Standard Deviation (Population) | 20.3% | 11.8% |
Similar Demographics by Child Poverty Under the Age of 5
Demographics Similar to Alaska Natives by Child Poverty Under the Age of 5
In terms of child poverty under the age of 5, the demographic groups most similar to Alaska Natives are Immigrants from Ecuador (19.6%, a difference of 0.060%), Immigrants from Guyana (19.6%, a difference of 0.11%), Osage (19.6%, a difference of 0.22%), Immigrants from Ghana (19.6%, a difference of 0.24%), and Immigrants from Western Africa (19.7%, a difference of 0.42%).
| Demographics | Rating | Rank | Child Poverty Under the Age of 5 |
| Immigrants | Micronesia | 0.9 /100 | #234 | Tragic 19.4% |
| Immigrants | Laos | 0.8 /100 | #235 | Tragic 19.4% |
| Immigrants | Trinidad and Tobago | 0.8 /100 | #236 | Tragic 19.4% |
| Immigrants | Cabo Verde | 0.6 /100 | #237 | Tragic 19.5% |
| Salvadorans | 0.6 /100 | #238 | Tragic 19.5% |
| Vietnamese | 0.6 /100 | #239 | Tragic 19.5% |
| Immigrants | Ecuador | 0.5 /100 | #240 | Tragic 19.6% |
| Alaska Natives | 0.5 /100 | #241 | Tragic 19.6% |
| Immigrants | Guyana | 0.5 /100 | #242 | Tragic 19.6% |
| Osage | 0.5 /100 | #243 | Tragic 19.6% |
| Immigrants | Ghana | 0.5 /100 | #244 | Tragic 19.6% |
| Immigrants | Western Africa | 0.4 /100 | #245 | Tragic 19.7% |
| Cree | 0.4 /100 | #246 | Tragic 19.7% |
| Guyanese | 0.4 /100 | #247 | Tragic 19.7% |
| Marshallese | 0.4 /100 | #248 | Tragic 19.7% |
Demographics Similar to Kenyans by Child Poverty Under the Age of 5
In terms of child poverty under the age of 5, the demographic groups most similar to Kenyans are Immigrants from Bosnia and Herzegovina (17.5%, a difference of 0.040%), Carpatho Rusyn (17.5%, a difference of 0.12%), French (17.5%, a difference of 0.12%), Immigrants from Armenia (17.5%, a difference of 0.37%), and Immigrants from Costa Rica (17.4%, a difference of 0.48%).
| Demographics | Rating | Rank | Child Poverty Under the Age of 5 |
| South American Indians | 41.4 /100 | #180 | Average 17.4% |
| Immigrants | Germany | 41.0 /100 | #181 | Average 17.4% |
| Arabs | 40.7 /100 | #182 | Average 17.4% |
| Lebanese | 40.3 /100 | #183 | Average 17.4% |
| Immigrants | Costa Rica | 39.0 /100 | #184 | Fair 17.4% |
| Immigrants | Armenia | 38.0 /100 | #185 | Fair 17.5% |
| Immigrants | Bosnia and Herzegovina | 35.0 /100 | #186 | Fair 17.5% |
| Kenyans | 34.7 /100 | #187 | Fair 17.5% |
| Carpatho Rusyns | 33.6 /100 | #188 | Fair 17.5% |
| French | 33.6 /100 | #189 | Fair 17.5% |
| Slovaks | 29.2 /100 | #190 | Fair 17.6% |
| Immigrants | Afghanistan | 27.9 /100 | #191 | Fair 17.7% |
| Immigrants | Uruguay | 27.8 /100 | #192 | Fair 17.7% |
| Immigrants | Uganda | 25.0 /100 | #193 | Fair 17.7% |
| French Canadians | 24.6 /100 | #194 | Fair 17.7% |