Bulgarian vs Immigrants from Kuwait Single Father Poverty
COMPARE
Bulgarian
Immigrants from Kuwait
Single Father Poverty
Single Father Poverty Comparison
Bulgarians
Immigrants from Kuwait
15.8%
SINGLE FATHER POVERTY
94.8/ 100
METRIC RATING
111th/ 347
METRIC RANK
16.0%
SINGLE FATHER POVERTY
81.4/ 100
METRIC RATING
144th/ 347
METRIC RANK
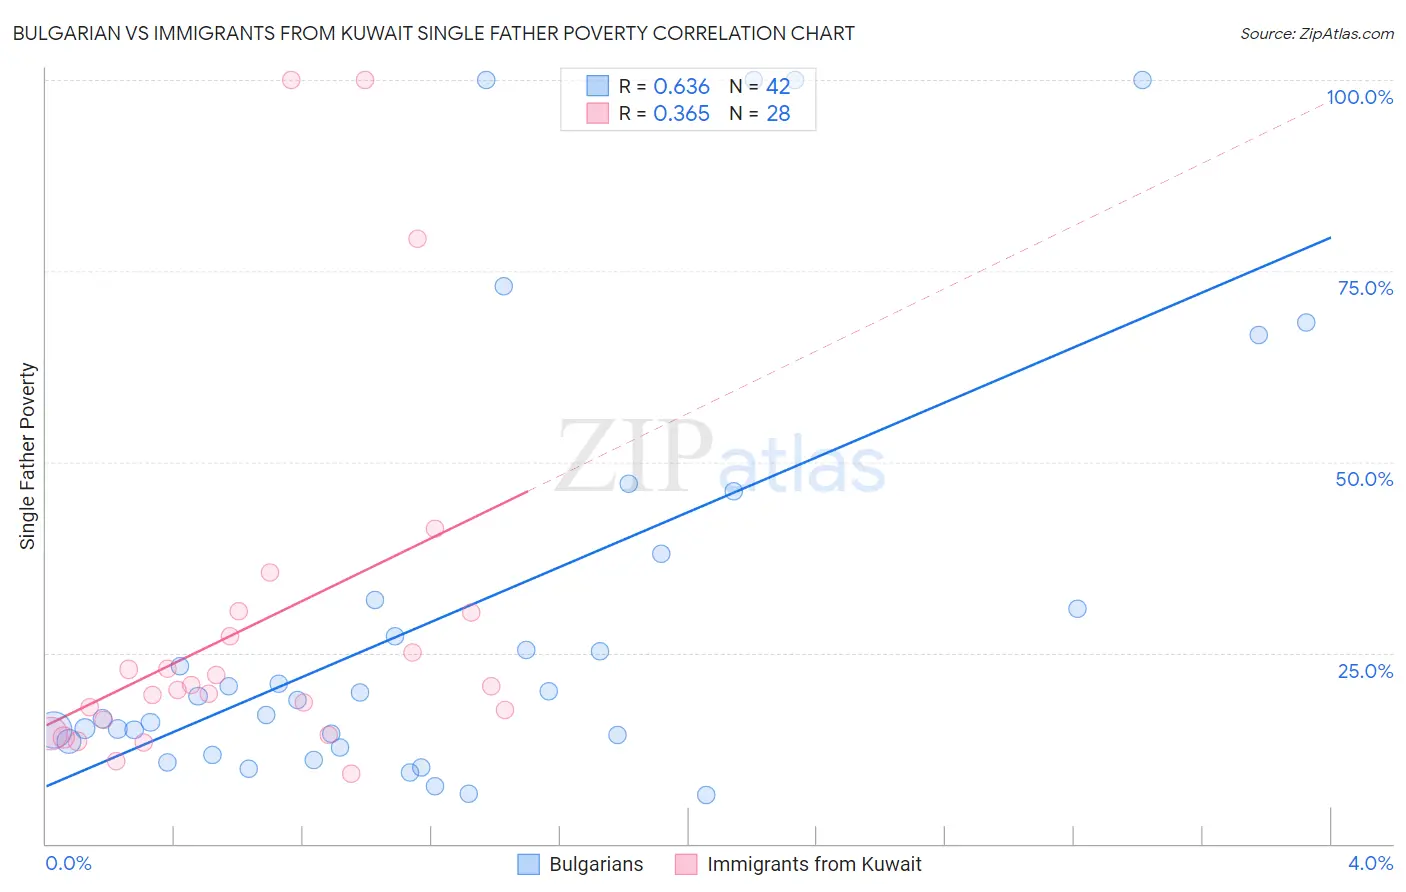
Bulgarian vs Immigrants from Kuwait Single Father Poverty Correlation Chart
The statistical analysis conducted on geographies consisting of 171,442,330 people shows a significant positive correlation between the proportion of Bulgarians and poverty level among single fathers in the United States with a correlation coefficient (R) of 0.636 and weighted average of 15.8%. Similarly, the statistical analysis conducted on geographies consisting of 120,904,433 people shows a mild positive correlation between the proportion of Immigrants from Kuwait and poverty level among single fathers in the United States with a correlation coefficient (R) of 0.365 and weighted average of 16.0%, a difference of 1.6%.
Single Father Poverty Correlation Summary
| Measurement | Bulgarian | Immigrants from Kuwait |
| Minimum | 6.3% | 9.1% |
| Maximum | 100.0% | 100.0% |
| Range | 93.7% | 90.9% |
| Mean | 30.2% | 28.5% |
| Median | 19.1% | 20.4% |
| Interquartile 25% (IQ1) | 13.4% | 15.3% |
| Interquartile 75% (IQ3) | 32.0% | 28.8% |
| Interquartile Range (IQR) | 18.5% | 13.4% |
| Standard Deviation (Sample) | 27.9% | 24.1% |
| Standard Deviation (Population) | 27.6% | 23.7% |
Similar Demographics by Single Father Poverty
Demographics Similar to Bulgarians by Single Father Poverty
In terms of single father poverty, the demographic groups most similar to Bulgarians are Immigrants from Latvia (15.8%, a difference of 0.030%), Immigrants from Africa (15.8%, a difference of 0.050%), Turkish (15.8%, a difference of 0.060%), Danish (15.8%, a difference of 0.080%), and Argentinean (15.8%, a difference of 0.090%).
| Demographics | Rating | Rank | Single Father Poverty |
| Australians | 96.1 /100 | #104 | Exceptional 15.7% |
| Immigrants | Australia | 96.1 /100 | #105 | Exceptional 15.7% |
| Immigrants | Poland | 95.8 /100 | #106 | Exceptional 15.7% |
| Native Hawaiians | 95.8 /100 | #107 | Exceptional 15.7% |
| Pakistanis | 95.7 /100 | #108 | Exceptional 15.7% |
| Turks | 95.1 /100 | #109 | Exceptional 15.8% |
| Immigrants | Africa | 95.1 /100 | #110 | Exceptional 15.8% |
| Bulgarians | 94.8 /100 | #111 | Exceptional 15.8% |
| Immigrants | Latvia | 94.7 /100 | #112 | Exceptional 15.8% |
| Danes | 94.5 /100 | #113 | Exceptional 15.8% |
| Argentineans | 94.4 /100 | #114 | Exceptional 15.8% |
| Immigrants | Thailand | 93.6 /100 | #115 | Exceptional 15.8% |
| Immigrants | Argentina | 92.8 /100 | #116 | Exceptional 15.8% |
| Immigrants | Colombia | 92.6 /100 | #117 | Exceptional 15.8% |
| Immigrants | Eastern Europe | 92.5 /100 | #118 | Exceptional 15.8% |
Demographics Similar to Immigrants from Kuwait by Single Father Poverty
In terms of single father poverty, the demographic groups most similar to Immigrants from Kuwait are Immigrants from Western Asia (16.0%, a difference of 0.050%), Immigrants from Central America (16.0%, a difference of 0.13%), Liberian (16.0%, a difference of 0.15%), Immigrants from Mexico (16.0%, a difference of 0.15%), and Immigrants from Hungary (16.1%, a difference of 0.22%).
| Demographics | Rating | Rank | Single Father Poverty |
| Immigrants | Azores | 87.2 /100 | #137 | Excellent 15.9% |
| Central Americans | 87.1 /100 | #138 | Excellent 16.0% |
| South Americans | 85.9 /100 | #139 | Excellent 16.0% |
| Immigrants | Netherlands | 85.3 /100 | #140 | Excellent 16.0% |
| Liberians | 83.3 /100 | #141 | Excellent 16.0% |
| Immigrants | Mexico | 83.3 /100 | #142 | Excellent 16.0% |
| Immigrants | Central America | 83.1 /100 | #143 | Excellent 16.0% |
| Immigrants | Kuwait | 81.4 /100 | #144 | Excellent 16.0% |
| Immigrants | Western Asia | 80.7 /100 | #145 | Excellent 16.0% |
| Immigrants | Hungary | 78.3 /100 | #146 | Good 16.1% |
| Colombians | 77.1 /100 | #147 | Good 16.1% |
| Nigerians | 76.8 /100 | #148 | Good 16.1% |
| South Africans | 75.1 /100 | #149 | Good 16.1% |
| Jordanians | 74.2 /100 | #150 | Good 16.1% |
| Immigrants | France | 73.1 /100 | #151 | Good 16.1% |