Ethiopian vs Ecuadorian Child Poverty Among Boys Under 16
COMPARE
Ethiopian
Ecuadorian
Child Poverty Among Boys Under 16
Child Poverty Among Boys Under 16 Comparison
Ethiopians
Ecuadorians
16.5%
CHILD POVERTY AMONG BOYS UNDER 16
47.8/ 100
METRIC RATING
177th/ 347
METRIC RANK
19.3%
CHILD POVERTY AMONG BOYS UNDER 16
0.2/ 100
METRIC RATING
255th/ 347
METRIC RANK
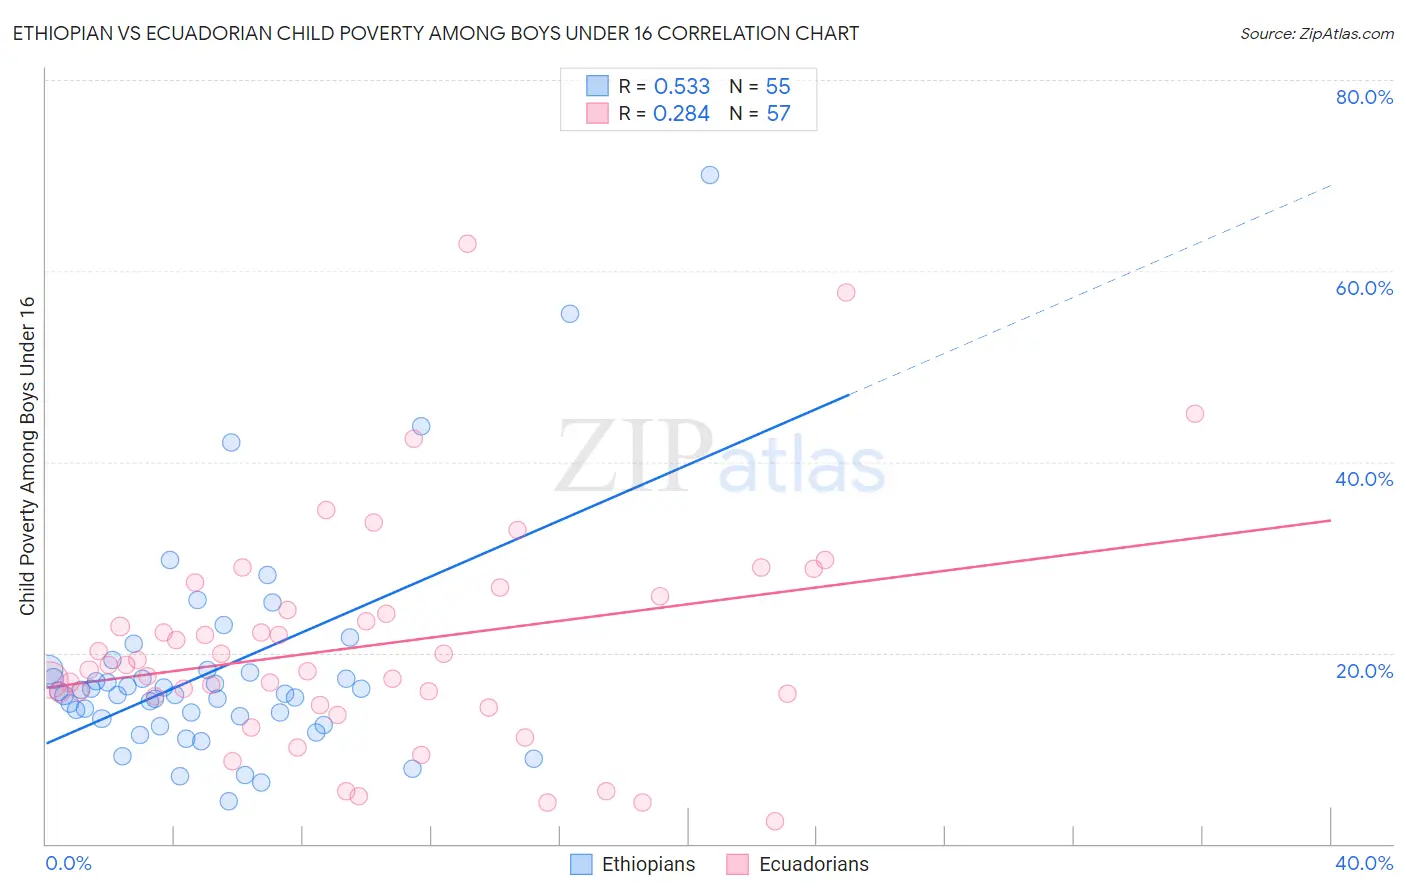
Ethiopian vs Ecuadorian Child Poverty Among Boys Under 16 Correlation Chart
The statistical analysis conducted on geographies consisting of 221,584,616 people shows a substantial positive correlation between the proportion of Ethiopians and poverty level among boys under the age of 16 in the United States with a correlation coefficient (R) of 0.533 and weighted average of 16.5%. Similarly, the statistical analysis conducted on geographies consisting of 313,514,032 people shows a weak positive correlation between the proportion of Ecuadorians and poverty level among boys under the age of 16 in the United States with a correlation coefficient (R) of 0.284 and weighted average of 19.3%, a difference of 17.3%.
Child Poverty Among Boys Under 16 Correlation Summary
| Measurement | Ethiopian | Ecuadorian |
| Minimum | 4.4% | 2.4% |
| Maximum | 70.0% | 62.8% |
| Range | 65.6% | 60.4% |
| Mean | 18.2% | 20.7% |
| Median | 15.7% | 18.7% |
| Interquartile 25% (IQ1) | 13.2% | 15.0% |
| Interquartile 75% (IQ3) | 18.2% | 25.2% |
| Interquartile Range (IQR) | 5.1% | 10.3% |
| Standard Deviation (Sample) | 11.4% | 11.7% |
| Standard Deviation (Population) | 11.3% | 11.6% |
Similar Demographics by Child Poverty Among Boys Under 16
Demographics Similar to Ethiopians by Child Poverty Among Boys Under 16
In terms of child poverty among boys under 16, the demographic groups most similar to Ethiopians are White/Caucasian (16.5%, a difference of 0.040%), Scotch-Irish (16.5%, a difference of 0.040%), Hungarian (16.5%, a difference of 0.060%), Immigrants from Syria (16.5%, a difference of 0.14%), and Uruguayan (16.4%, a difference of 0.24%).
| Demographics | Rating | Rank | Child Poverty Among Boys Under 16 |
| Immigrants | Bosnia and Herzegovina | 51.7 /100 | #170 | Average 16.4% |
| Immigrants | Ethiopia | 51.3 /100 | #171 | Average 16.4% |
| Immigrants | Colombia | 50.8 /100 | #172 | Average 16.4% |
| Tsimshian | 50.5 /100 | #173 | Average 16.4% |
| Uruguayans | 50.0 /100 | #174 | Average 16.4% |
| Immigrants | Syria | 49.0 /100 | #175 | Average 16.5% |
| Whites/Caucasians | 48.2 /100 | #176 | Average 16.5% |
| Ethiopians | 47.8 /100 | #177 | Average 16.5% |
| Scotch-Irish | 47.5 /100 | #178 | Average 16.5% |
| Hungarians | 47.3 /100 | #179 | Average 16.5% |
| Hawaiians | 45.5 /100 | #180 | Average 16.5% |
| South American Indians | 44.3 /100 | #181 | Average 16.5% |
| Lebanese | 43.3 /100 | #182 | Average 16.6% |
| Kenyans | 41.0 /100 | #183 | Average 16.6% |
| Celtics | 40.6 /100 | #184 | Average 16.6% |
Demographics Similar to Ecuadorians by Child Poverty Among Boys Under 16
In terms of child poverty among boys under 16, the demographic groups most similar to Ecuadorians are Trinidadian and Tobagonian (19.3%, a difference of 0.0%), Immigrants from Liberia (19.3%, a difference of 0.030%), Mexican American Indian (19.4%, a difference of 0.23%), Potawatomi (19.4%, a difference of 0.25%), and Liberian (19.3%, a difference of 0.27%).
| Demographics | Rating | Rank | Child Poverty Among Boys Under 16 |
| Salvadorans | 0.3 /100 | #248 | Tragic 19.0% |
| Alsatians | 0.3 /100 | #249 | Tragic 19.1% |
| Immigrants | Burma/Myanmar | 0.2 /100 | #250 | Tragic 19.2% |
| French American Indians | 0.2 /100 | #251 | Tragic 19.2% |
| Immigrants | Western Africa | 0.2 /100 | #252 | Tragic 19.3% |
| Liberians | 0.2 /100 | #253 | Tragic 19.3% |
| Trinidadians and Tobagonians | 0.2 /100 | #254 | Tragic 19.3% |
| Ecuadorians | 0.2 /100 | #255 | Tragic 19.3% |
| Immigrants | Liberia | 0.2 /100 | #256 | Tragic 19.3% |
| Mexican American Indians | 0.2 /100 | #257 | Tragic 19.4% |
| Potawatomi | 0.2 /100 | #258 | Tragic 19.4% |
| Spanish Americans | 0.2 /100 | #259 | Tragic 19.4% |
| Shoshone | 0.2 /100 | #260 | Tragic 19.4% |
| Immigrants | Ghana | 0.2 /100 | #261 | Tragic 19.4% |
| Immigrants | Guyana | 0.1 /100 | #262 | Tragic 19.5% |