Ethiopian vs English Child Poverty Among Boys Under 16
COMPARE
Ethiopian
English
Child Poverty Among Boys Under 16
Child Poverty Among Boys Under 16 Comparison
Ethiopians
English
16.5%
CHILD POVERTY AMONG BOYS UNDER 16
47.8/ 100
METRIC RATING
177th/ 347
METRIC RANK
15.1%
CHILD POVERTY AMONG BOYS UNDER 16
94.3/ 100
METRIC RATING
110th/ 347
METRIC RANK
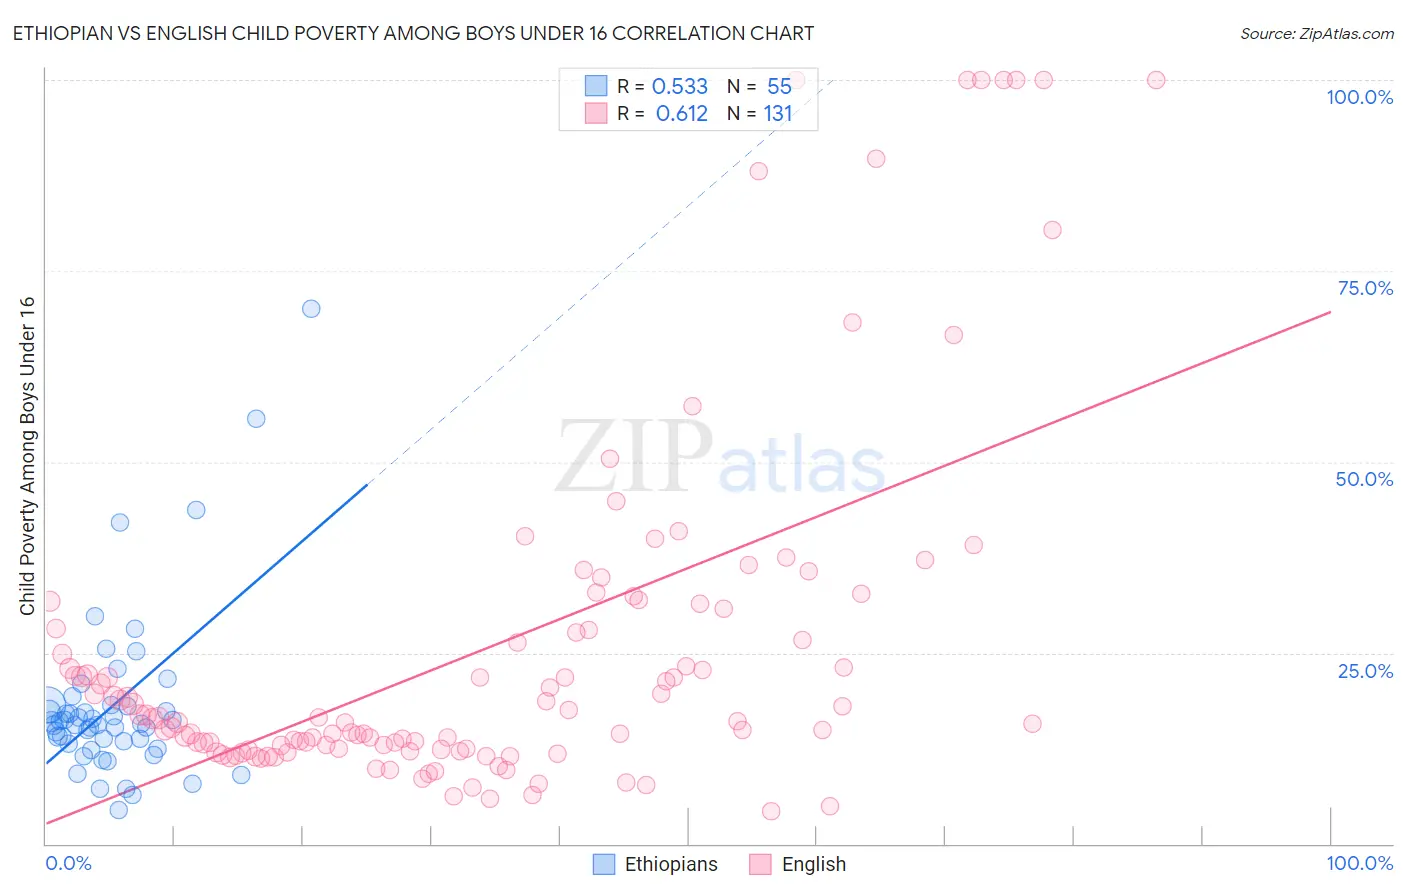
Ethiopian vs English Child Poverty Among Boys Under 16 Correlation Chart
The statistical analysis conducted on geographies consisting of 221,584,616 people shows a substantial positive correlation between the proportion of Ethiopians and poverty level among boys under the age of 16 in the United States with a correlation coefficient (R) of 0.533 and weighted average of 16.5%. Similarly, the statistical analysis conducted on geographies consisting of 556,516,168 people shows a significant positive correlation between the proportion of English and poverty level among boys under the age of 16 in the United States with a correlation coefficient (R) of 0.612 and weighted average of 15.1%, a difference of 8.8%.
Child Poverty Among Boys Under 16 Correlation Summary
| Measurement | Ethiopian | English |
| Minimum | 4.4% | 4.3% |
| Maximum | 70.0% | 100.0% |
| Range | 65.6% | 95.7% |
| Mean | 18.2% | 25.5% |
| Median | 15.7% | 16.4% |
| Interquartile 25% (IQ1) | 13.2% | 12.4% |
| Interquartile 75% (IQ3) | 18.2% | 28.2% |
| Interquartile Range (IQR) | 5.1% | 15.8% |
| Standard Deviation (Sample) | 11.4% | 23.3% |
| Standard Deviation (Population) | 11.3% | 23.2% |
Similar Demographics by Child Poverty Among Boys Under 16
Demographics Similar to Ethiopians by Child Poverty Among Boys Under 16
In terms of child poverty among boys under 16, the demographic groups most similar to Ethiopians are White/Caucasian (16.5%, a difference of 0.040%), Scotch-Irish (16.5%, a difference of 0.040%), Hungarian (16.5%, a difference of 0.060%), Immigrants from Syria (16.5%, a difference of 0.14%), and Uruguayan (16.4%, a difference of 0.24%).
| Demographics | Rating | Rank | Child Poverty Among Boys Under 16 |
| Immigrants | Bosnia and Herzegovina | 51.7 /100 | #170 | Average 16.4% |
| Immigrants | Ethiopia | 51.3 /100 | #171 | Average 16.4% |
| Immigrants | Colombia | 50.8 /100 | #172 | Average 16.4% |
| Tsimshian | 50.5 /100 | #173 | Average 16.4% |
| Uruguayans | 50.0 /100 | #174 | Average 16.4% |
| Immigrants | Syria | 49.0 /100 | #175 | Average 16.5% |
| Whites/Caucasians | 48.2 /100 | #176 | Average 16.5% |
| Ethiopians | 47.8 /100 | #177 | Average 16.5% |
| Scotch-Irish | 47.5 /100 | #178 | Average 16.5% |
| Hungarians | 47.3 /100 | #179 | Average 16.5% |
| Hawaiians | 45.5 /100 | #180 | Average 16.5% |
| South American Indians | 44.3 /100 | #181 | Average 16.5% |
| Lebanese | 43.3 /100 | #182 | Average 16.6% |
| Kenyans | 41.0 /100 | #183 | Average 16.6% |
| Celtics | 40.6 /100 | #184 | Average 16.6% |
Demographics Similar to English by Child Poverty Among Boys Under 16
In terms of child poverty among boys under 16, the demographic groups most similar to English are Immigrants from Zimbabwe (15.2%, a difference of 0.050%), Basque (15.2%, a difference of 0.25%), Pakistani (15.1%, a difference of 0.26%), Irish (15.2%, a difference of 0.29%), and Immigrants from England (15.1%, a difference of 0.30%).
| Demographics | Rating | Rank | Child Poverty Among Boys Under 16 |
| Immigrants | Denmark | 95.6 /100 | #103 | Exceptional 15.0% |
| Immigrants | Switzerland | 95.4 /100 | #104 | Exceptional 15.0% |
| Dutch | 95.4 /100 | #105 | Exceptional 15.0% |
| Serbians | 95.2 /100 | #106 | Exceptional 15.1% |
| Jordanians | 95.1 /100 | #107 | Exceptional 15.1% |
| Immigrants | England | 94.8 /100 | #108 | Exceptional 15.1% |
| Pakistanis | 94.7 /100 | #109 | Exceptional 15.1% |
| English | 94.3 /100 | #110 | Exceptional 15.1% |
| Immigrants | Zimbabwe | 94.2 /100 | #111 | Exceptional 15.2% |
| Basques | 93.8 /100 | #112 | Exceptional 15.2% |
| Irish | 93.8 /100 | #113 | Exceptional 15.2% |
| Immigrants | Ukraine | 93.6 /100 | #114 | Exceptional 15.2% |
| Armenians | 93.6 /100 | #115 | Exceptional 15.2% |
| Immigrants | South Eastern Asia | 93.5 /100 | #116 | Exceptional 15.2% |
| Immigrants | Vietnam | 93.5 /100 | #117 | Exceptional 15.2% |