Estonian vs Immigrants from Ethiopia Child Poverty Among Boys Under 16
COMPARE
Estonian
Immigrants from Ethiopia
Child Poverty Among Boys Under 16
Child Poverty Among Boys Under 16 Comparison
Estonians
Immigrants from Ethiopia
14.1%
CHILD POVERTY AMONG BOYS UNDER 16
99.4/ 100
METRIC RATING
44th/ 347
METRIC RANK
16.4%
CHILD POVERTY AMONG BOYS UNDER 16
51.3/ 100
METRIC RATING
171st/ 347
METRIC RANK
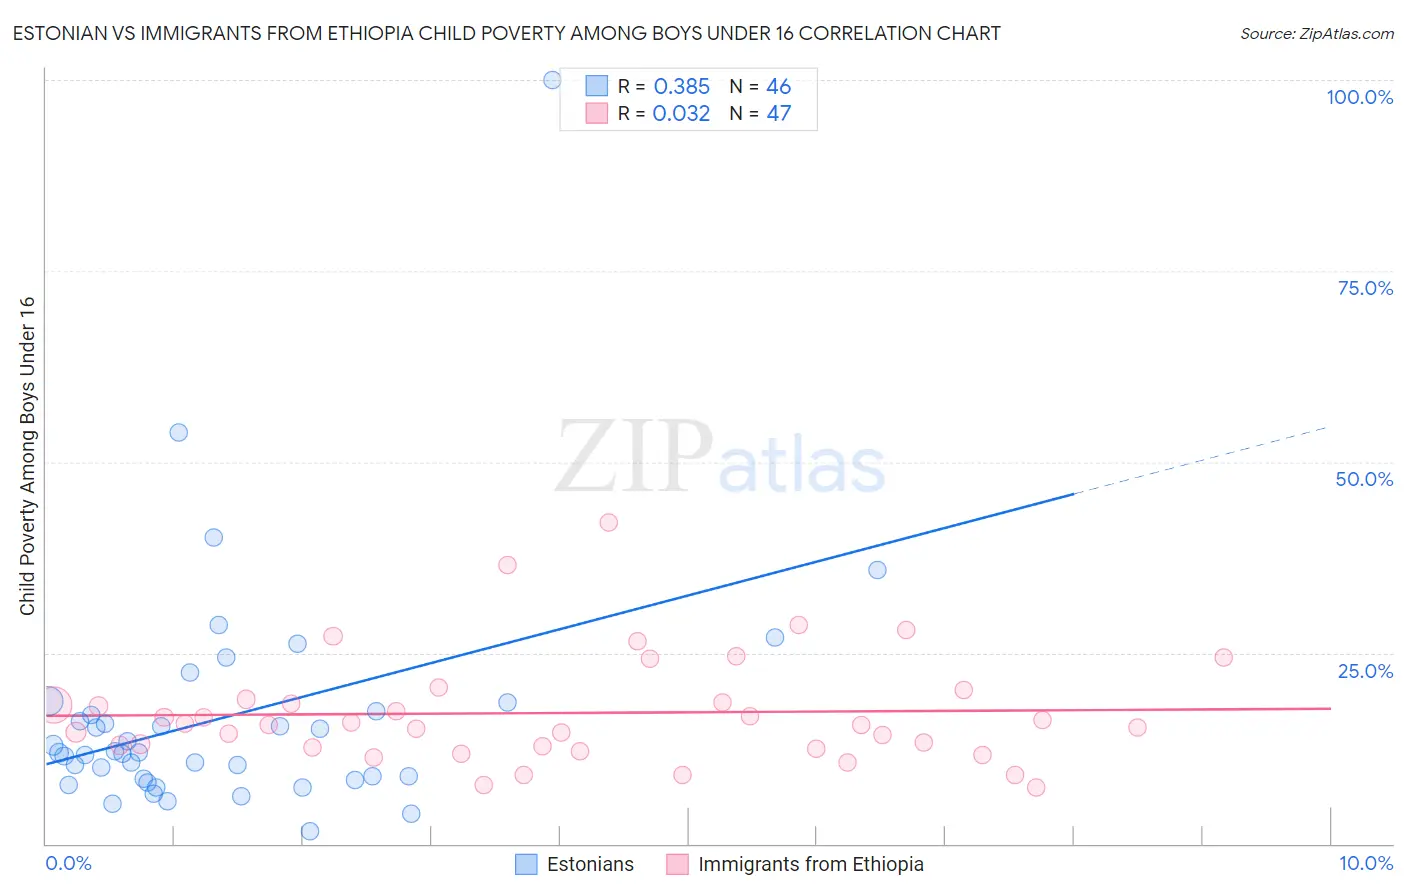
Estonian vs Immigrants from Ethiopia Child Poverty Among Boys Under 16 Correlation Chart
The statistical analysis conducted on geographies consisting of 122,063,894 people shows a mild positive correlation between the proportion of Estonians and poverty level among boys under the age of 16 in the United States with a correlation coefficient (R) of 0.385 and weighted average of 14.1%. Similarly, the statistical analysis conducted on geographies consisting of 210,013,422 people shows no correlation between the proportion of Immigrants from Ethiopia and poverty level among boys under the age of 16 in the United States with a correlation coefficient (R) of 0.032 and weighted average of 16.4%, a difference of 16.8%.
Child Poverty Among Boys Under 16 Correlation Summary
| Measurement | Estonian | Immigrants from Ethiopia |
| Minimum | 1.7% | 7.4% |
| Maximum | 100.0% | 42.0% |
| Range | 98.3% | 34.6% |
| Mean | 16.6% | 17.1% |
| Median | 12.0% | 15.5% |
| Interquartile 25% (IQ1) | 8.4% | 12.5% |
| Interquartile 75% (IQ3) | 17.4% | 18.9% |
| Interquartile Range (IQR) | 9.0% | 6.4% |
| Standard Deviation (Sample) | 16.0% | 7.1% |
| Standard Deviation (Population) | 15.8% | 7.0% |
Similar Demographics by Child Poverty Among Boys Under 16
Demographics Similar to Estonians by Child Poverty Among Boys Under 16
In terms of child poverty among boys under 16, the demographic groups most similar to Estonians are Immigrants from Scotland (14.1%, a difference of 0.090%), Greek (14.1%, a difference of 0.20%), Croatian (14.0%, a difference of 0.21%), Immigrants from Moldova (14.1%, a difference of 0.47%), and Immigrants from Indonesia (14.1%, a difference of 0.49%).
| Demographics | Rating | Rank | Child Poverty Among Boys Under 16 |
| Immigrants | Sri Lanka | 99.6 /100 | #37 | Exceptional 13.9% |
| Immigrants | Northern Europe | 99.6 /100 | #38 | Exceptional 13.9% |
| Immigrants | Australia | 99.6 /100 | #39 | Exceptional 13.9% |
| Immigrants | Asia | 99.6 /100 | #40 | Exceptional 13.9% |
| Lithuanians | 99.6 /100 | #41 | Exceptional 14.0% |
| Koreans | 99.6 /100 | #42 | Exceptional 14.0% |
| Croatians | 99.5 /100 | #43 | Exceptional 14.0% |
| Estonians | 99.4 /100 | #44 | Exceptional 14.1% |
| Immigrants | Scotland | 99.4 /100 | #45 | Exceptional 14.1% |
| Greeks | 99.4 /100 | #46 | Exceptional 14.1% |
| Immigrants | Moldova | 99.4 /100 | #47 | Exceptional 14.1% |
| Immigrants | Indonesia | 99.4 /100 | #48 | Exceptional 14.1% |
| Czechs | 99.3 /100 | #49 | Exceptional 14.1% |
| Italians | 99.2 /100 | #50 | Exceptional 14.2% |
| Immigrants | Greece | 99.2 /100 | #51 | Exceptional 14.2% |
Demographics Similar to Immigrants from Ethiopia by Child Poverty Among Boys Under 16
In terms of child poverty among boys under 16, the demographic groups most similar to Immigrants from Ethiopia are Immigrants from Bosnia and Herzegovina (16.4%, a difference of 0.050%), Immigrants from Colombia (16.4%, a difference of 0.050%), Tsimshian (16.4%, a difference of 0.080%), Uruguayan (16.4%, a difference of 0.14%), and Immigrants from Syria (16.5%, a difference of 0.25%).
| Demographics | Rating | Rank | Child Poverty Among Boys Under 16 |
| Immigrants | Albania | 67.9 /100 | #164 | Good 16.1% |
| Colombians | 65.2 /100 | #165 | Good 16.1% |
| Immigrants | Germany | 63.6 /100 | #166 | Good 16.2% |
| Afghans | 55.4 /100 | #167 | Average 16.3% |
| South Americans | 55.3 /100 | #168 | Average 16.3% |
| Immigrants | Saudi Arabia | 53.6 /100 | #169 | Average 16.4% |
| Immigrants | Bosnia and Herzegovina | 51.7 /100 | #170 | Average 16.4% |
| Immigrants | Ethiopia | 51.3 /100 | #171 | Average 16.4% |
| Immigrants | Colombia | 50.8 /100 | #172 | Average 16.4% |
| Tsimshian | 50.5 /100 | #173 | Average 16.4% |
| Uruguayans | 50.0 /100 | #174 | Average 16.4% |
| Immigrants | Syria | 49.0 /100 | #175 | Average 16.5% |
| Whites/Caucasians | 48.2 /100 | #176 | Average 16.5% |
| Ethiopians | 47.8 /100 | #177 | Average 16.5% |
| Scotch-Irish | 47.5 /100 | #178 | Average 16.5% |