Indonesian vs Immigrants from Iran Male Poverty
COMPARE
Indonesian
Immigrants from Iran
Male Poverty
Male Poverty Comparison
Indonesians
Immigrants from Iran
13.8%
MALE POVERTY
0.0/ 100
METRIC RATING
292nd/ 347
METRIC RANK
9.9%
MALE POVERTY
99.1/ 100
METRIC RATING
42nd/ 347
METRIC RANK
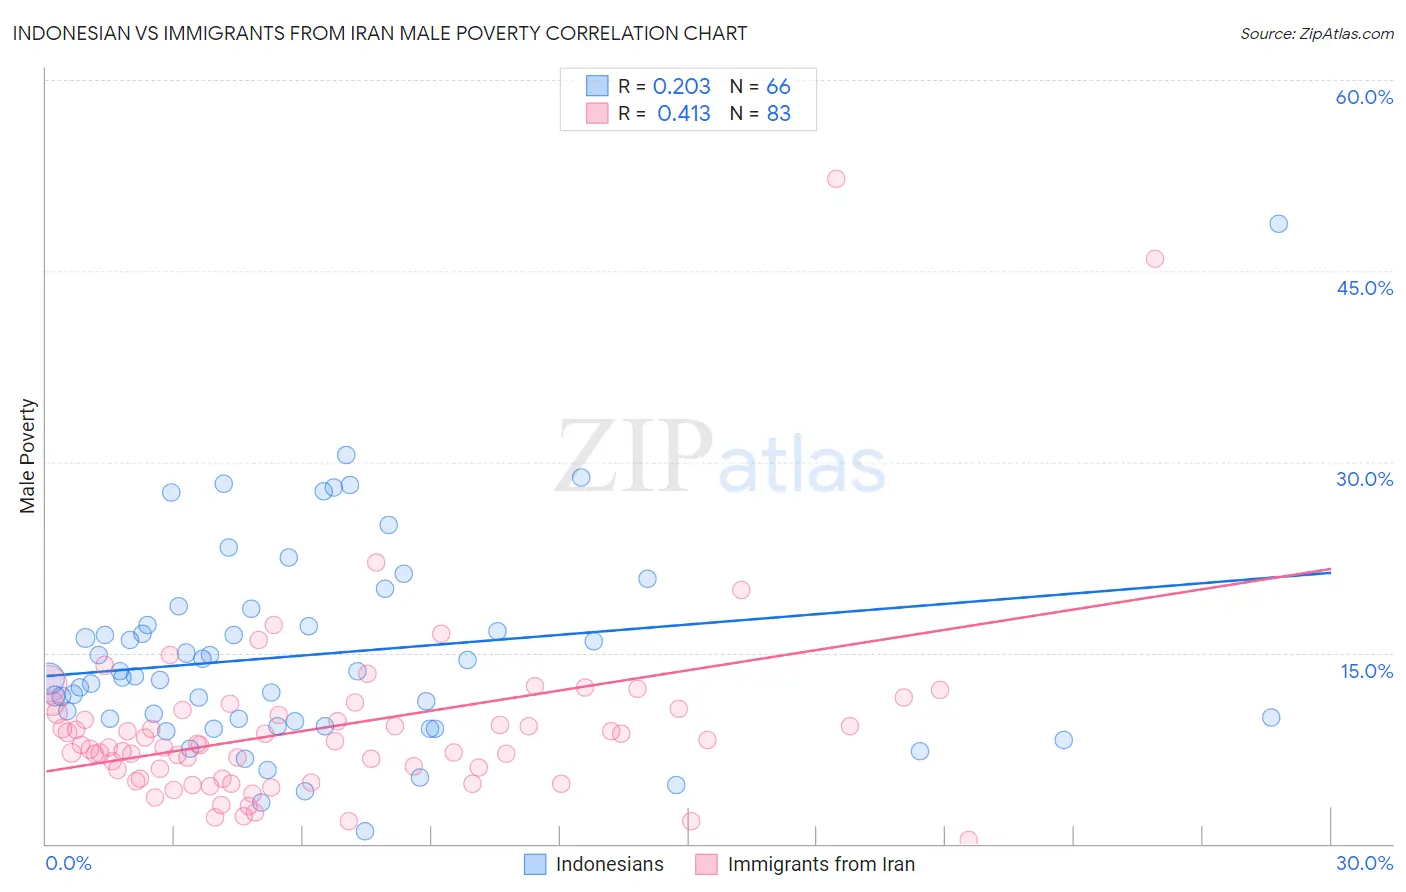
Indonesian vs Immigrants from Iran Male Poverty Correlation Chart
The statistical analysis conducted on geographies consisting of 162,645,449 people shows a weak positive correlation between the proportion of Indonesians and poverty level among males in the United States with a correlation coefficient (R) of 0.203 and weighted average of 13.8%. Similarly, the statistical analysis conducted on geographies consisting of 279,773,882 people shows a moderate positive correlation between the proportion of Immigrants from Iran and poverty level among males in the United States with a correlation coefficient (R) of 0.413 and weighted average of 9.9%, a difference of 39.9%.
Male Poverty Correlation Summary
| Measurement | Indonesian | Immigrants from Iran |
| Minimum | 1.0% | 0.33% |
| Maximum | 48.7% | 52.3% |
| Range | 47.6% | 51.9% |
| Mean | 14.9% | 9.2% |
| Median | 13.1% | 7.8% |
| Interquartile 25% (IQ1) | 9.6% | 5.1% |
| Interquartile 75% (IQ3) | 17.2% | 10.5% |
| Interquartile Range (IQR) | 7.5% | 5.4% |
| Standard Deviation (Sample) | 8.0% | 7.5% |
| Standard Deviation (Population) | 8.0% | 7.4% |
Similar Demographics by Male Poverty
Demographics Similar to Indonesians by Male Poverty
In terms of male poverty, the demographic groups most similar to Indonesians are Immigrants from Belize (13.8%, a difference of 0.010%), Hispanic or Latino (13.9%, a difference of 0.070%), Vietnamese (13.8%, a difference of 0.17%), Guatemalan (13.8%, a difference of 0.26%), and Immigrants from Zaire (13.8%, a difference of 0.26%).
| Demographics | Rating | Rank | Male Poverty |
| West Indians | 0.0 /100 | #285 | Tragic 13.8% |
| Shoshone | 0.0 /100 | #286 | Tragic 13.8% |
| Immigrants | Barbados | 0.0 /100 | #287 | Tragic 13.8% |
| Immigrants | St. Vincent and the Grenadines | 0.0 /100 | #288 | Tragic 13.8% |
| Guatemalans | 0.0 /100 | #289 | Tragic 13.8% |
| Immigrants | Zaire | 0.0 /100 | #290 | Tragic 13.8% |
| Vietnamese | 0.0 /100 | #291 | Tragic 13.8% |
| Indonesians | 0.0 /100 | #292 | Tragic 13.8% |
| Immigrants | Belize | 0.0 /100 | #293 | Tragic 13.8% |
| Hispanics or Latinos | 0.0 /100 | #294 | Tragic 13.9% |
| Immigrants | Central America | 0.0 /100 | #295 | Tragic 13.9% |
| Cajuns | 0.0 /100 | #296 | Tragic 13.9% |
| Inupiat | 0.0 /100 | #297 | Tragic 14.0% |
| Blackfeet | 0.0 /100 | #298 | Tragic 14.0% |
| Immigrants | Guatemala | 0.0 /100 | #299 | Tragic 14.0% |
Demographics Similar to Immigrants from Iran by Male Poverty
In terms of male poverty, the demographic groups most similar to Immigrants from Iran are Korean (9.9%, a difference of 0.24%), Immigrants from Moldova (9.9%, a difference of 0.26%), Cypriot (9.9%, a difference of 0.34%), Immigrants from Pakistan (9.9%, a difference of 0.42%), and Russian (9.9%, a difference of 0.42%).
| Demographics | Rating | Rank | Male Poverty |
| Iranians | 99.4 /100 | #35 | Exceptional 9.8% |
| Czechs | 99.4 /100 | #36 | Exceptional 9.8% |
| Immigrants | Greece | 99.3 /100 | #37 | Exceptional 9.8% |
| Immigrants | Pakistan | 99.2 /100 | #38 | Exceptional 9.9% |
| Russians | 99.2 /100 | #39 | Exceptional 9.9% |
| Cypriots | 99.2 /100 | #40 | Exceptional 9.9% |
| Koreans | 99.2 /100 | #41 | Exceptional 9.9% |
| Immigrants | Iran | 99.1 /100 | #42 | Exceptional 9.9% |
| Immigrants | Moldova | 99.0 /100 | #43 | Exceptional 9.9% |
| Immigrants | Romania | 98.9 /100 | #44 | Exceptional 9.9% |
| Immigrants | Serbia | 98.9 /100 | #45 | Exceptional 10.0% |
| Turks | 98.9 /100 | #46 | Exceptional 10.0% |
| Immigrants | Singapore | 98.8 /100 | #47 | Exceptional 10.0% |
| Immigrants | Japan | 98.8 /100 | #48 | Exceptional 10.0% |
| Slovenes | 98.8 /100 | #49 | Exceptional 10.0% |