Egyptian vs Immigrants from Caribbean Unemployment Among Ages 30 to 34 years
COMPARE
Egyptian
Immigrants from Caribbean
Unemployment Among Ages 30 to 34 years
Unemployment Among Ages 30 to 34 years Comparison
Egyptians
Immigrants from Caribbean
5.3%
UNEMPLOYMENT AMONG AGES 30 TO 34 YEARS
86.4/ 100
METRIC RATING
110th/ 347
METRIC RANK
6.4%
UNEMPLOYMENT AMONG AGES 30 TO 34 YEARS
0.0/ 100
METRIC RATING
281st/ 347
METRIC RANK
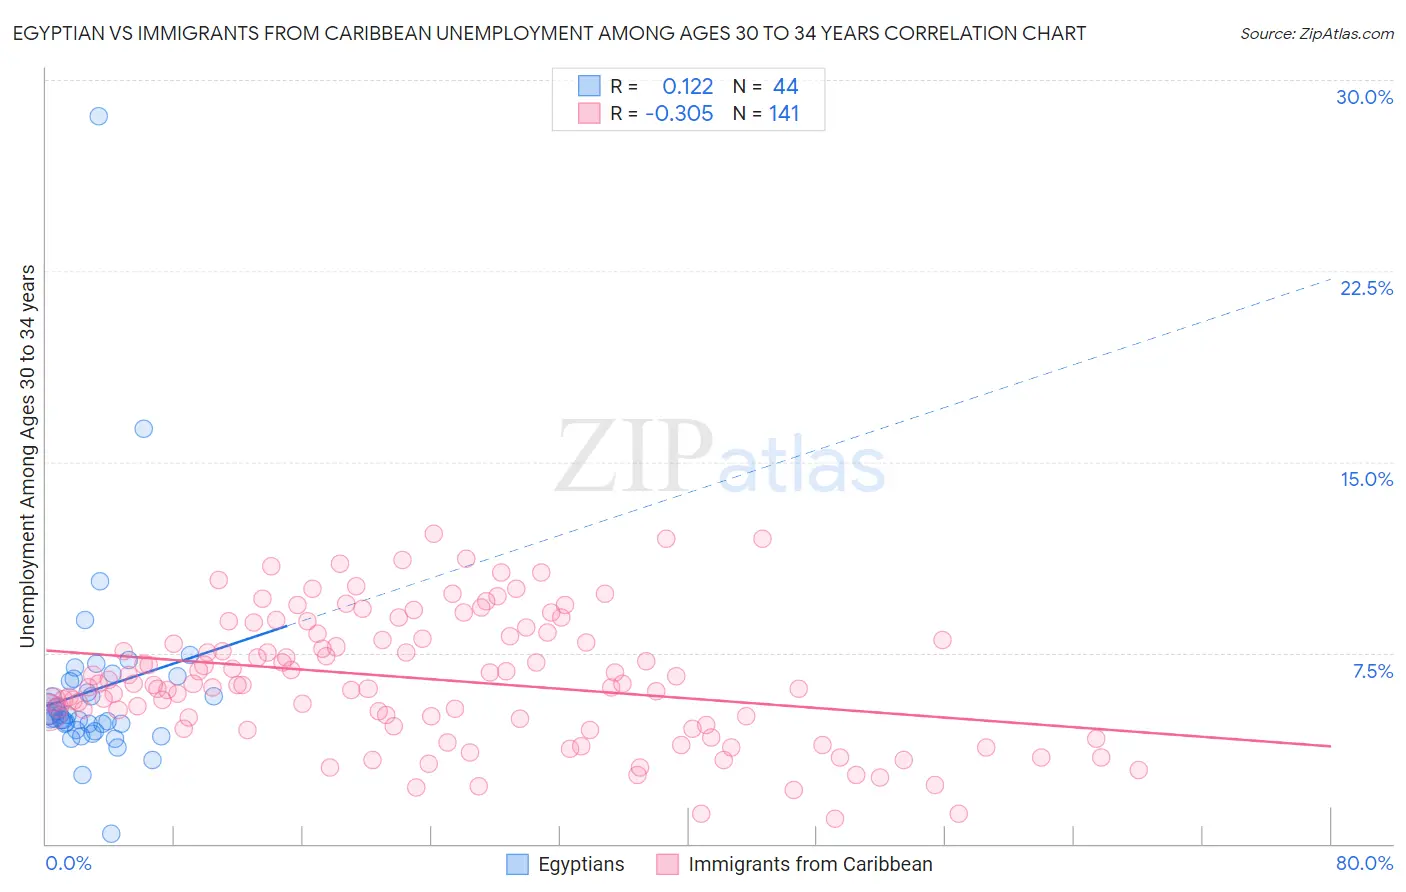
Egyptian vs Immigrants from Caribbean Unemployment Among Ages 30 to 34 years Correlation Chart
The statistical analysis conducted on geographies consisting of 267,282,387 people shows a poor positive correlation between the proportion of Egyptians and unemployment rate among population between the ages 30 and 34 in the United States with a correlation coefficient (R) of 0.122 and weighted average of 5.3%. Similarly, the statistical analysis conducted on geographies consisting of 419,806,633 people shows a mild negative correlation between the proportion of Immigrants from Caribbean and unemployment rate among population between the ages 30 and 34 in the United States with a correlation coefficient (R) of -0.305 and weighted average of 6.4%, a difference of 20.9%.
Unemployment Among Ages 30 to 34 years Correlation Summary
| Measurement | Egyptian | Immigrants from Caribbean |
| Minimum | 0.40% | 1.0% |
| Maximum | 28.6% | 12.2% |
| Range | 28.2% | 11.2% |
| Mean | 6.0% | 6.5% |
| Median | 5.0% | 6.3% |
| Interquartile 25% (IQ1) | 4.6% | 4.6% |
| Interquartile 75% (IQ3) | 6.4% | 8.2% |
| Interquartile Range (IQR) | 1.8% | 3.6% |
| Standard Deviation (Sample) | 4.2% | 2.5% |
| Standard Deviation (Population) | 4.1% | 2.5% |
Similar Demographics by Unemployment Among Ages 30 to 34 years
Demographics Similar to Egyptians by Unemployment Among Ages 30 to 34 years
In terms of unemployment among ages 30 to 34 years, the demographic groups most similar to Egyptians are Immigrants from Pakistan (5.3%, a difference of 0.020%), Immigrants from Chile (5.3%, a difference of 0.050%), Swiss (5.3%, a difference of 0.060%), Icelander (5.3%, a difference of 0.12%), and Immigrants from Middle Africa (5.3%, a difference of 0.12%).
| Demographics | Rating | Rank | Unemployment Among Ages 30 to 34 years |
| Immigrants | Jordan | 88.8 /100 | #103 | Excellent 5.3% |
| Northern Europeans | 87.9 /100 | #104 | Excellent 5.3% |
| Argentineans | 87.9 /100 | #105 | Excellent 5.3% |
| Croatians | 87.6 /100 | #106 | Excellent 5.3% |
| Icelanders | 87.2 /100 | #107 | Excellent 5.3% |
| Immigrants | Middle Africa | 87.1 /100 | #108 | Excellent 5.3% |
| Immigrants | Chile | 86.7 /100 | #109 | Excellent 5.3% |
| Egyptians | 86.4 /100 | #110 | Excellent 5.3% |
| Immigrants | Pakistan | 86.2 /100 | #111 | Excellent 5.3% |
| Swiss | 85.9 /100 | #112 | Excellent 5.3% |
| Immigrants | Spain | 85.6 /100 | #113 | Excellent 5.3% |
| Estonians | 83.7 /100 | #114 | Excellent 5.3% |
| Immigrants | Albania | 83.4 /100 | #115 | Excellent 5.3% |
| Eastern Europeans | 83.2 /100 | #116 | Excellent 5.3% |
| Australians | 83.1 /100 | #117 | Excellent 5.3% |
Demographics Similar to Immigrants from Caribbean by Unemployment Among Ages 30 to 34 years
In terms of unemployment among ages 30 to 34 years, the demographic groups most similar to Immigrants from Caribbean are Cherokee (6.4%, a difference of 0.32%), Cree (6.4%, a difference of 0.37%), African (6.4%, a difference of 0.37%), Hispanic or Latino (6.4%, a difference of 0.40%), and Immigrants from Bangladesh (6.4%, a difference of 0.47%).
| Demographics | Rating | Rank | Unemployment Among Ages 30 to 34 years |
| U.S. Virgin Islanders | 0.0 /100 | #274 | Tragic 6.3% |
| Ecuadorians | 0.0 /100 | #275 | Tragic 6.3% |
| Pennsylvania Germans | 0.0 /100 | #276 | Tragic 6.3% |
| Immigrants | Ecuador | 0.0 /100 | #277 | Tragic 6.3% |
| Osage | 0.0 /100 | #278 | Tragic 6.3% |
| Cree | 0.0 /100 | #279 | Tragic 6.4% |
| Cherokee | 0.0 /100 | #280 | Tragic 6.4% |
| Immigrants | Caribbean | 0.0 /100 | #281 | Tragic 6.4% |
| Africans | 0.0 /100 | #282 | Tragic 6.4% |
| Hispanics or Latinos | 0.0 /100 | #283 | Tragic 6.4% |
| Immigrants | Bangladesh | 0.0 /100 | #284 | Tragic 6.4% |
| Choctaw | 0.0 /100 | #285 | Tragic 6.4% |
| Central American Indians | 0.0 /100 | #286 | Tragic 6.4% |
| Immigrants | West Indies | 0.0 /100 | #287 | Tragic 6.4% |
| Senegalese | 0.0 /100 | #288 | Tragic 6.4% |