Eastern European vs Native Hawaiian Child Poverty Among Boys Under 16
COMPARE
Eastern European
Native Hawaiian
Child Poverty Among Boys Under 16
Child Poverty Among Boys Under 16 Comparison
Eastern Europeans
Native Hawaiians
13.5%
CHILD POVERTY AMONG BOYS UNDER 16
99.8/ 100
METRIC RATING
28th/ 347
METRIC RANK
15.2%
CHILD POVERTY AMONG BOYS UNDER 16
93.4/ 100
METRIC RATING
118th/ 347
METRIC RANK
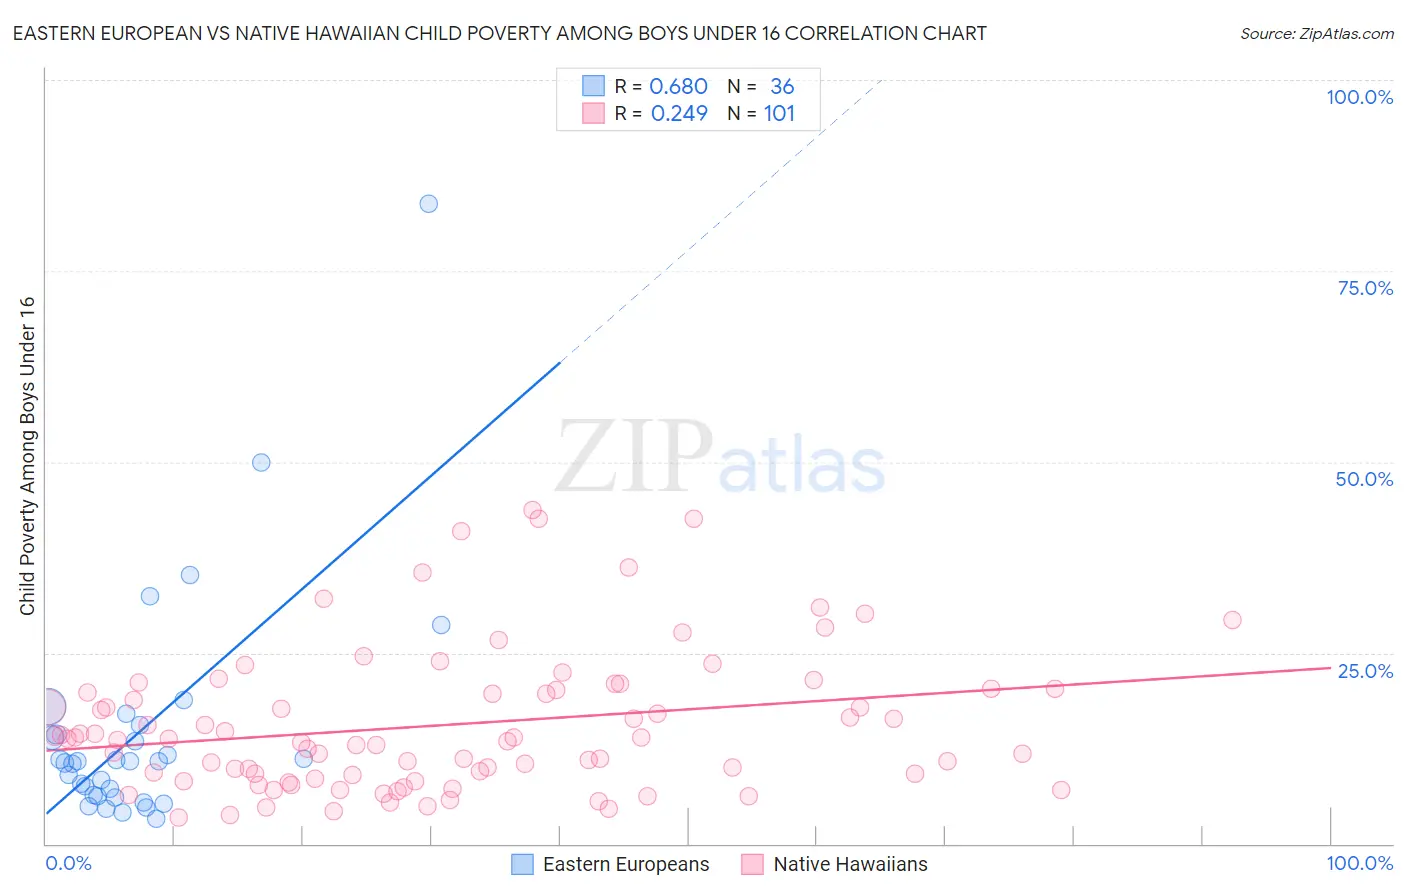
Eastern European vs Native Hawaiian Child Poverty Among Boys Under 16 Correlation Chart
The statistical analysis conducted on geographies consisting of 449,246,772 people shows a significant positive correlation between the proportion of Eastern Europeans and poverty level among boys under the age of 16 in the United States with a correlation coefficient (R) of 0.680 and weighted average of 13.5%. Similarly, the statistical analysis conducted on geographies consisting of 328,514,795 people shows a weak positive correlation between the proportion of Native Hawaiians and poverty level among boys under the age of 16 in the United States with a correlation coefficient (R) of 0.249 and weighted average of 15.2%, a difference of 12.5%.
Child Poverty Among Boys Under 16 Correlation Summary
| Measurement | Eastern European | Native Hawaiian |
| Minimum | 3.2% | 3.5% |
| Maximum | 83.8% | 43.7% |
| Range | 80.6% | 40.2% |
| Mean | 14.7% | 15.6% |
| Median | 10.8% | 13.7% |
| Interquartile 25% (IQ1) | 6.3% | 8.7% |
| Interquartile 75% (IQ3) | 15.0% | 20.2% |
| Interquartile Range (IQR) | 8.6% | 11.5% |
| Standard Deviation (Sample) | 15.4% | 9.2% |
| Standard Deviation (Population) | 15.2% | 9.1% |
Similar Demographics by Child Poverty Among Boys Under 16
Demographics Similar to Eastern Europeans by Child Poverty Among Boys Under 16
In terms of child poverty among boys under 16, the demographic groups most similar to Eastern Europeans are Asian (13.5%, a difference of 0.060%), Immigrants from Bolivia (13.5%, a difference of 0.15%), Cypriot (13.6%, a difference of 0.19%), Okinawan (13.5%, a difference of 0.23%), and Swedish (13.6%, a difference of 0.28%).
| Demographics | Rating | Rank | Child Poverty Among Boys Under 16 |
| Immigrants | Eastern Asia | 99.9 /100 | #21 | Exceptional 13.3% |
| Tongans | 99.9 /100 | #22 | Exceptional 13.4% |
| Latvians | 99.9 /100 | #23 | Exceptional 13.4% |
| Immigrants | Lithuania | 99.8 /100 | #24 | Exceptional 13.5% |
| Okinawans | 99.8 /100 | #25 | Exceptional 13.5% |
| Immigrants | Bolivia | 99.8 /100 | #26 | Exceptional 13.5% |
| Asians | 99.8 /100 | #27 | Exceptional 13.5% |
| Eastern Europeans | 99.8 /100 | #28 | Exceptional 13.5% |
| Cypriots | 99.8 /100 | #29 | Exceptional 13.6% |
| Swedes | 99.8 /100 | #30 | Exceptional 13.6% |
| Turks | 99.8 /100 | #31 | Exceptional 13.6% |
| Immigrants | China | 99.8 /100 | #32 | Exceptional 13.6% |
| Danes | 99.8 /100 | #33 | Exceptional 13.6% |
| Assyrians/Chaldeans/Syriacs | 99.8 /100 | #34 | Exceptional 13.6% |
| Russians | 99.7 /100 | #35 | Exceptional 13.8% |
Demographics Similar to Native Hawaiians by Child Poverty Among Boys Under 16
In terms of child poverty among boys under 16, the demographic groups most similar to Native Hawaiians are Immigrants from Vietnam (15.2%, a difference of 0.050%), Immigrants from South Eastern Asia (15.2%, a difference of 0.080%), Armenian (15.2%, a difference of 0.12%), Belgian (15.2%, a difference of 0.12%), and Immigrants from Ukraine (15.2%, a difference of 0.13%).
| Demographics | Rating | Rank | Child Poverty Among Boys Under 16 |
| Immigrants | Zimbabwe | 94.2 /100 | #111 | Exceptional 15.2% |
| Basques | 93.8 /100 | #112 | Exceptional 15.2% |
| Irish | 93.8 /100 | #113 | Exceptional 15.2% |
| Immigrants | Ukraine | 93.6 /100 | #114 | Exceptional 15.2% |
| Armenians | 93.6 /100 | #115 | Exceptional 15.2% |
| Immigrants | South Eastern Asia | 93.5 /100 | #116 | Exceptional 15.2% |
| Immigrants | Vietnam | 93.5 /100 | #117 | Exceptional 15.2% |
| Native Hawaiians | 93.4 /100 | #118 | Exceptional 15.2% |
| Belgians | 93.1 /100 | #119 | Exceptional 15.2% |
| South Africans | 93.0 /100 | #120 | Exceptional 15.2% |
| Scottish | 93.0 /100 | #121 | Exceptional 15.2% |
| Immigrants | Malaysia | 92.8 /100 | #122 | Exceptional 15.3% |
| Immigrants | Norway | 92.3 /100 | #123 | Exceptional 15.3% |
| Tlingit-Haida | 92.2 /100 | #124 | Exceptional 15.3% |
| Czechoslovakians | 92.1 /100 | #125 | Exceptional 15.3% |