Immigrants from Peru vs Native Hawaiian Child Poverty Among Boys Under 16
COMPARE
Immigrants from Peru
Native Hawaiian
Child Poverty Among Boys Under 16
Child Poverty Among Boys Under 16 Comparison
Immigrants from Peru
Native Hawaiians
15.7%
CHILD POVERTY AMONG BOYS UNDER 16
83.5/ 100
METRIC RATING
144th/ 347
METRIC RANK
15.2%
CHILD POVERTY AMONG BOYS UNDER 16
93.4/ 100
METRIC RATING
118th/ 347
METRIC RANK
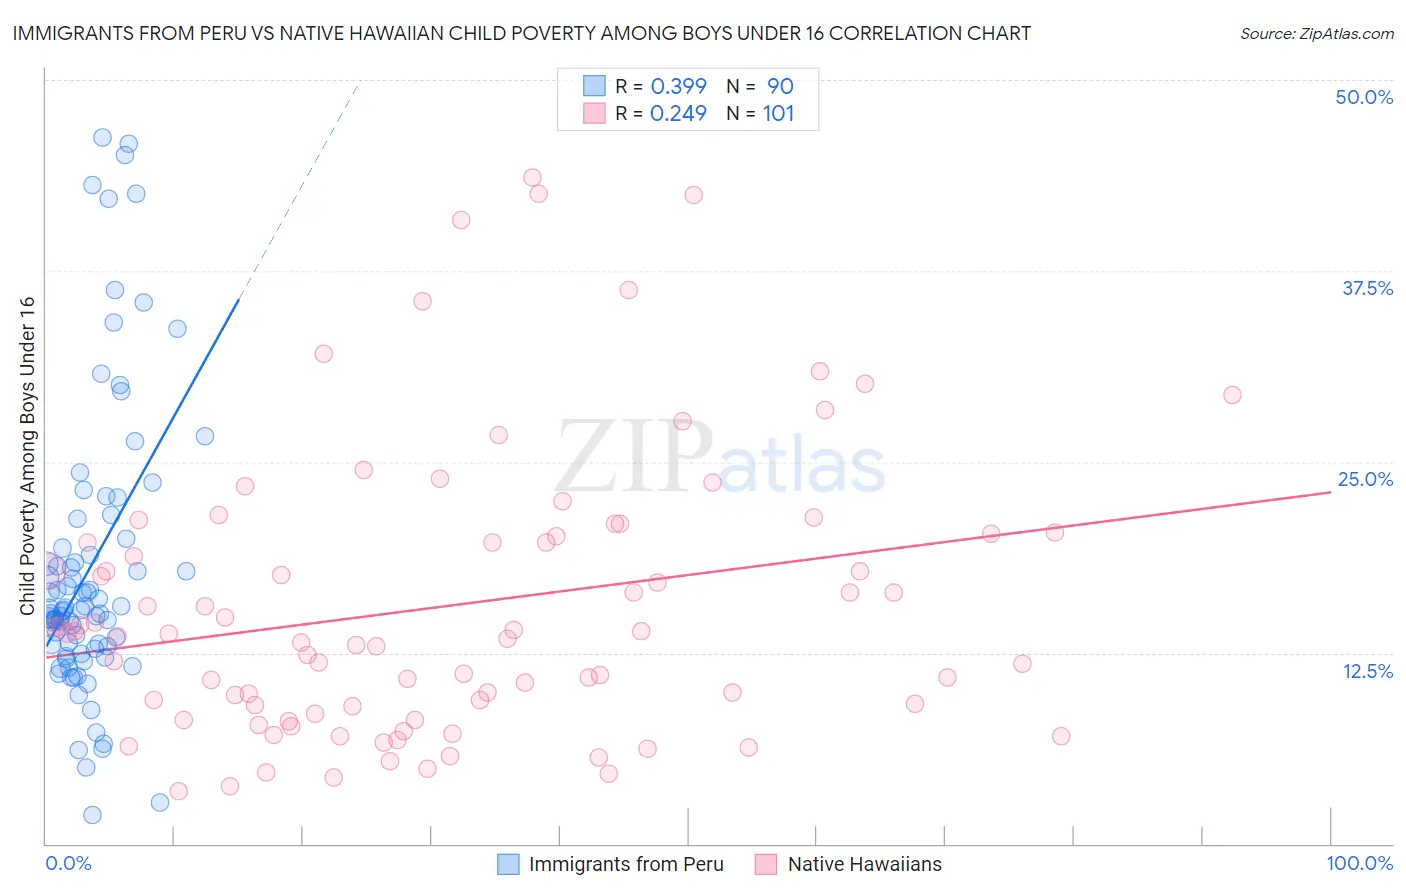
Immigrants from Peru vs Native Hawaiian Child Poverty Among Boys Under 16 Correlation Chart
The statistical analysis conducted on geographies consisting of 324,822,417 people shows a mild positive correlation between the proportion of Immigrants from Peru and poverty level among boys under the age of 16 in the United States with a correlation coefficient (R) of 0.399 and weighted average of 15.7%. Similarly, the statistical analysis conducted on geographies consisting of 328,514,795 people shows a weak positive correlation between the proportion of Native Hawaiians and poverty level among boys under the age of 16 in the United States with a correlation coefficient (R) of 0.249 and weighted average of 15.2%, a difference of 3.1%.
Child Poverty Among Boys Under 16 Correlation Summary
| Measurement | Immigrants from Peru | Native Hawaiian |
| Minimum | 1.9% | 3.5% |
| Maximum | 46.2% | 43.7% |
| Range | 44.3% | 40.2% |
| Mean | 18.2% | 15.6% |
| Median | 15.3% | 13.7% |
| Interquartile 25% (IQ1) | 12.8% | 8.7% |
| Interquartile 75% (IQ3) | 20.0% | 20.2% |
| Interquartile Range (IQR) | 7.2% | 11.5% |
| Standard Deviation (Sample) | 9.7% | 9.2% |
| Standard Deviation (Population) | 9.6% | 9.1% |
Similar Demographics by Child Poverty Among Boys Under 16
Demographics Similar to Immigrants from Peru by Child Poverty Among Boys Under 16
In terms of child poverty among boys under 16, the demographic groups most similar to Immigrants from Peru are Immigrants from Fiji (15.7%, a difference of 0.020%), Samoan (15.7%, a difference of 0.060%), Immigrants from Hungary (15.7%, a difference of 0.13%), New Zealander (15.7%, a difference of 0.21%), and Slavic (15.7%, a difference of 0.22%).
| Demographics | Rating | Rank | Child Poverty Among Boys Under 16 |
| Immigrants | Spain | 87.1 /100 | #137 | Excellent 15.6% |
| Immigrants | Southern Europe | 86.5 /100 | #138 | Excellent 15.6% |
| Albanians | 86.5 /100 | #139 | Excellent 15.6% |
| Immigrants | Kuwait | 85.6 /100 | #140 | Excellent 15.6% |
| Slavs | 84.5 /100 | #141 | Excellent 15.7% |
| Immigrants | Hungary | 84.1 /100 | #142 | Excellent 15.7% |
| Immigrants | Fiji | 83.6 /100 | #143 | Excellent 15.7% |
| Immigrants | Peru | 83.5 /100 | #144 | Excellent 15.7% |
| Samoans | 83.2 /100 | #145 | Excellent 15.7% |
| New Zealanders | 82.4 /100 | #146 | Excellent 15.7% |
| Venezuelans | 82.1 /100 | #147 | Excellent 15.7% |
| Brazilians | 81.0 /100 | #148 | Excellent 15.8% |
| Slovaks | 80.3 /100 | #149 | Excellent 15.8% |
| Immigrants | Jordan | 80.2 /100 | #150 | Excellent 15.8% |
| Puget Sound Salish | 79.8 /100 | #151 | Good 15.8% |
Demographics Similar to Native Hawaiians by Child Poverty Among Boys Under 16
In terms of child poverty among boys under 16, the demographic groups most similar to Native Hawaiians are Immigrants from Vietnam (15.2%, a difference of 0.050%), Immigrants from South Eastern Asia (15.2%, a difference of 0.080%), Armenian (15.2%, a difference of 0.12%), Belgian (15.2%, a difference of 0.12%), and Immigrants from Ukraine (15.2%, a difference of 0.13%).
| Demographics | Rating | Rank | Child Poverty Among Boys Under 16 |
| Immigrants | Zimbabwe | 94.2 /100 | #111 | Exceptional 15.2% |
| Basques | 93.8 /100 | #112 | Exceptional 15.2% |
| Irish | 93.8 /100 | #113 | Exceptional 15.2% |
| Immigrants | Ukraine | 93.6 /100 | #114 | Exceptional 15.2% |
| Armenians | 93.6 /100 | #115 | Exceptional 15.2% |
| Immigrants | South Eastern Asia | 93.5 /100 | #116 | Exceptional 15.2% |
| Immigrants | Vietnam | 93.5 /100 | #117 | Exceptional 15.2% |
| Native Hawaiians | 93.4 /100 | #118 | Exceptional 15.2% |
| Belgians | 93.1 /100 | #119 | Exceptional 15.2% |
| South Africans | 93.0 /100 | #120 | Exceptional 15.2% |
| Scottish | 93.0 /100 | #121 | Exceptional 15.2% |
| Immigrants | Malaysia | 92.8 /100 | #122 | Exceptional 15.3% |
| Immigrants | Norway | 92.3 /100 | #123 | Exceptional 15.3% |
| Tlingit-Haida | 92.2 /100 | #124 | Exceptional 15.3% |
| Czechoslovakians | 92.1 /100 | #125 | Exceptional 15.3% |