Ecuadorian vs Native Hawaiian Child Poverty Among Boys Under 16
COMPARE
Ecuadorian
Native Hawaiian
Child Poverty Among Boys Under 16
Child Poverty Among Boys Under 16 Comparison
Ecuadorians
Native Hawaiians
19.3%
CHILD POVERTY AMONG BOYS UNDER 16
0.2/ 100
METRIC RATING
255th/ 347
METRIC RANK
15.2%
CHILD POVERTY AMONG BOYS UNDER 16
93.4/ 100
METRIC RATING
118th/ 347
METRIC RANK
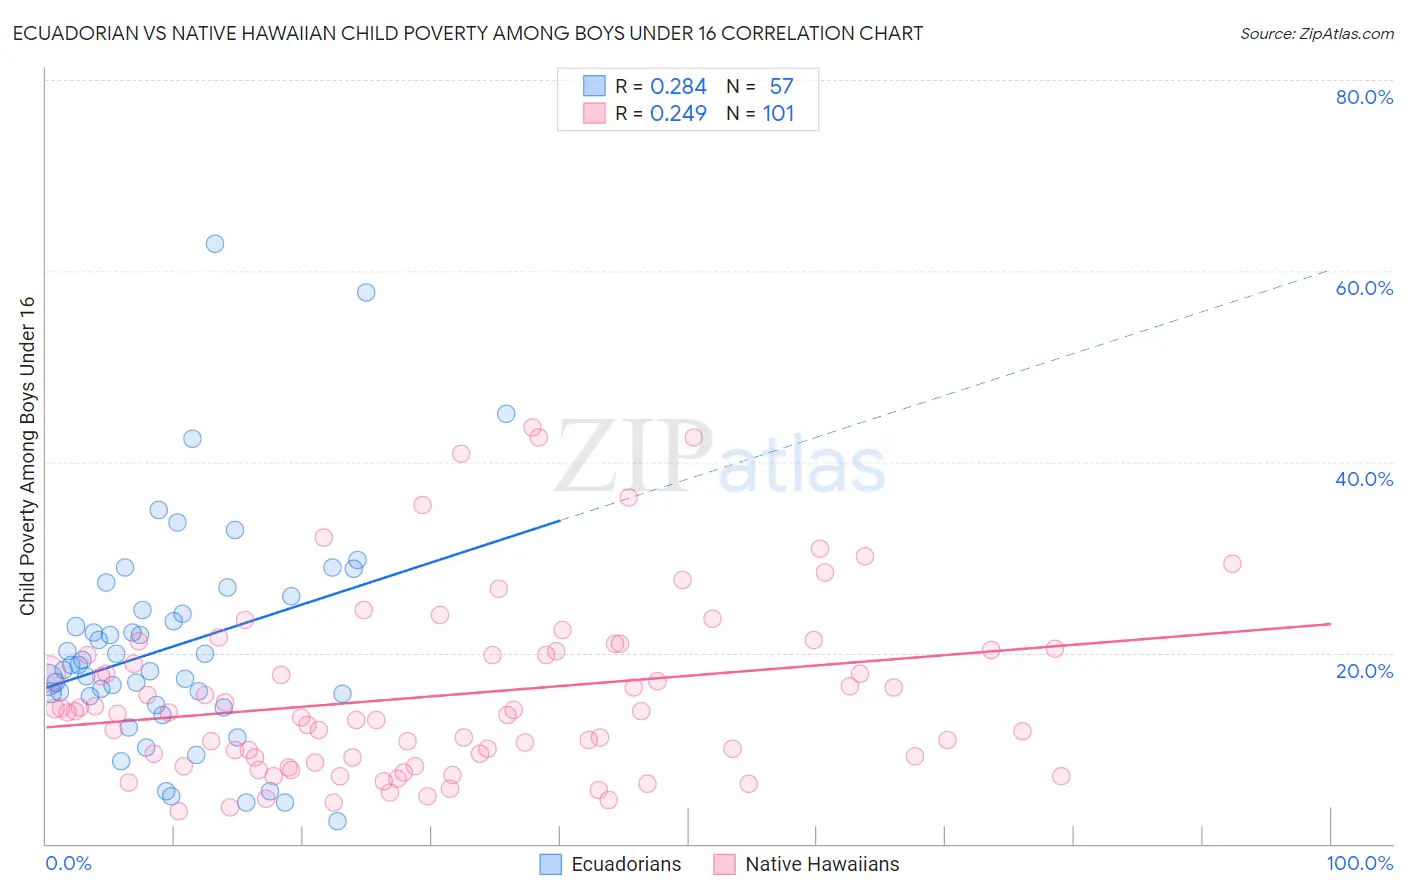
Ecuadorian vs Native Hawaiian Child Poverty Among Boys Under 16 Correlation Chart
The statistical analysis conducted on geographies consisting of 313,514,032 people shows a weak positive correlation between the proportion of Ecuadorians and poverty level among boys under the age of 16 in the United States with a correlation coefficient (R) of 0.284 and weighted average of 19.3%. Similarly, the statistical analysis conducted on geographies consisting of 328,514,795 people shows a weak positive correlation between the proportion of Native Hawaiians and poverty level among boys under the age of 16 in the United States with a correlation coefficient (R) of 0.249 and weighted average of 15.2%, a difference of 27.0%.
Child Poverty Among Boys Under 16 Correlation Summary
| Measurement | Ecuadorian | Native Hawaiian |
| Minimum | 2.4% | 3.5% |
| Maximum | 62.8% | 43.7% |
| Range | 60.4% | 40.2% |
| Mean | 20.7% | 15.6% |
| Median | 18.7% | 13.7% |
| Interquartile 25% (IQ1) | 15.0% | 8.7% |
| Interquartile 75% (IQ3) | 25.2% | 20.2% |
| Interquartile Range (IQR) | 10.3% | 11.5% |
| Standard Deviation (Sample) | 11.7% | 9.2% |
| Standard Deviation (Population) | 11.6% | 9.1% |
Similar Demographics by Child Poverty Among Boys Under 16
Demographics Similar to Ecuadorians by Child Poverty Among Boys Under 16
In terms of child poverty among boys under 16, the demographic groups most similar to Ecuadorians are Trinidadian and Tobagonian (19.3%, a difference of 0.0%), Immigrants from Liberia (19.3%, a difference of 0.030%), Mexican American Indian (19.4%, a difference of 0.23%), Potawatomi (19.4%, a difference of 0.25%), and Liberian (19.3%, a difference of 0.27%).
| Demographics | Rating | Rank | Child Poverty Among Boys Under 16 |
| Salvadorans | 0.3 /100 | #248 | Tragic 19.0% |
| Alsatians | 0.3 /100 | #249 | Tragic 19.1% |
| Immigrants | Burma/Myanmar | 0.2 /100 | #250 | Tragic 19.2% |
| French American Indians | 0.2 /100 | #251 | Tragic 19.2% |
| Immigrants | Western Africa | 0.2 /100 | #252 | Tragic 19.3% |
| Liberians | 0.2 /100 | #253 | Tragic 19.3% |
| Trinidadians and Tobagonians | 0.2 /100 | #254 | Tragic 19.3% |
| Ecuadorians | 0.2 /100 | #255 | Tragic 19.3% |
| Immigrants | Liberia | 0.2 /100 | #256 | Tragic 19.3% |
| Mexican American Indians | 0.2 /100 | #257 | Tragic 19.4% |
| Potawatomi | 0.2 /100 | #258 | Tragic 19.4% |
| Spanish Americans | 0.2 /100 | #259 | Tragic 19.4% |
| Shoshone | 0.2 /100 | #260 | Tragic 19.4% |
| Immigrants | Ghana | 0.2 /100 | #261 | Tragic 19.4% |
| Immigrants | Guyana | 0.1 /100 | #262 | Tragic 19.5% |
Demographics Similar to Native Hawaiians by Child Poverty Among Boys Under 16
In terms of child poverty among boys under 16, the demographic groups most similar to Native Hawaiians are Immigrants from Vietnam (15.2%, a difference of 0.050%), Immigrants from South Eastern Asia (15.2%, a difference of 0.080%), Armenian (15.2%, a difference of 0.12%), Belgian (15.2%, a difference of 0.12%), and Immigrants from Ukraine (15.2%, a difference of 0.13%).
| Demographics | Rating | Rank | Child Poverty Among Boys Under 16 |
| Immigrants | Zimbabwe | 94.2 /100 | #111 | Exceptional 15.2% |
| Basques | 93.8 /100 | #112 | Exceptional 15.2% |
| Irish | 93.8 /100 | #113 | Exceptional 15.2% |
| Immigrants | Ukraine | 93.6 /100 | #114 | Exceptional 15.2% |
| Armenians | 93.6 /100 | #115 | Exceptional 15.2% |
| Immigrants | South Eastern Asia | 93.5 /100 | #116 | Exceptional 15.2% |
| Immigrants | Vietnam | 93.5 /100 | #117 | Exceptional 15.2% |
| Native Hawaiians | 93.4 /100 | #118 | Exceptional 15.2% |
| Belgians | 93.1 /100 | #119 | Exceptional 15.2% |
| South Africans | 93.0 /100 | #120 | Exceptional 15.2% |
| Scottish | 93.0 /100 | #121 | Exceptional 15.2% |
| Immigrants | Malaysia | 92.8 /100 | #122 | Exceptional 15.3% |
| Immigrants | Norway | 92.3 /100 | #123 | Exceptional 15.3% |
| Tlingit-Haida | 92.2 /100 | #124 | Exceptional 15.3% |
| Czechoslovakians | 92.1 /100 | #125 | Exceptional 15.3% |