Eastern European vs Immigrants from Mexico In Labor Force | Age 20-24
COMPARE
Eastern European
Immigrants from Mexico
In Labor Force | Age 20-24
In Labor Force | Age 20-24 Comparison
Eastern Europeans
Immigrants from Mexico
74.8%
IN LABOR FORCE | AGE 20-24
25.4/ 100
METRIC RATING
195th/ 347
METRIC RANK
75.0%
IN LABOR FORCE | AGE 20-24
47.8/ 100
METRIC RATING
177th/ 347
METRIC RANK
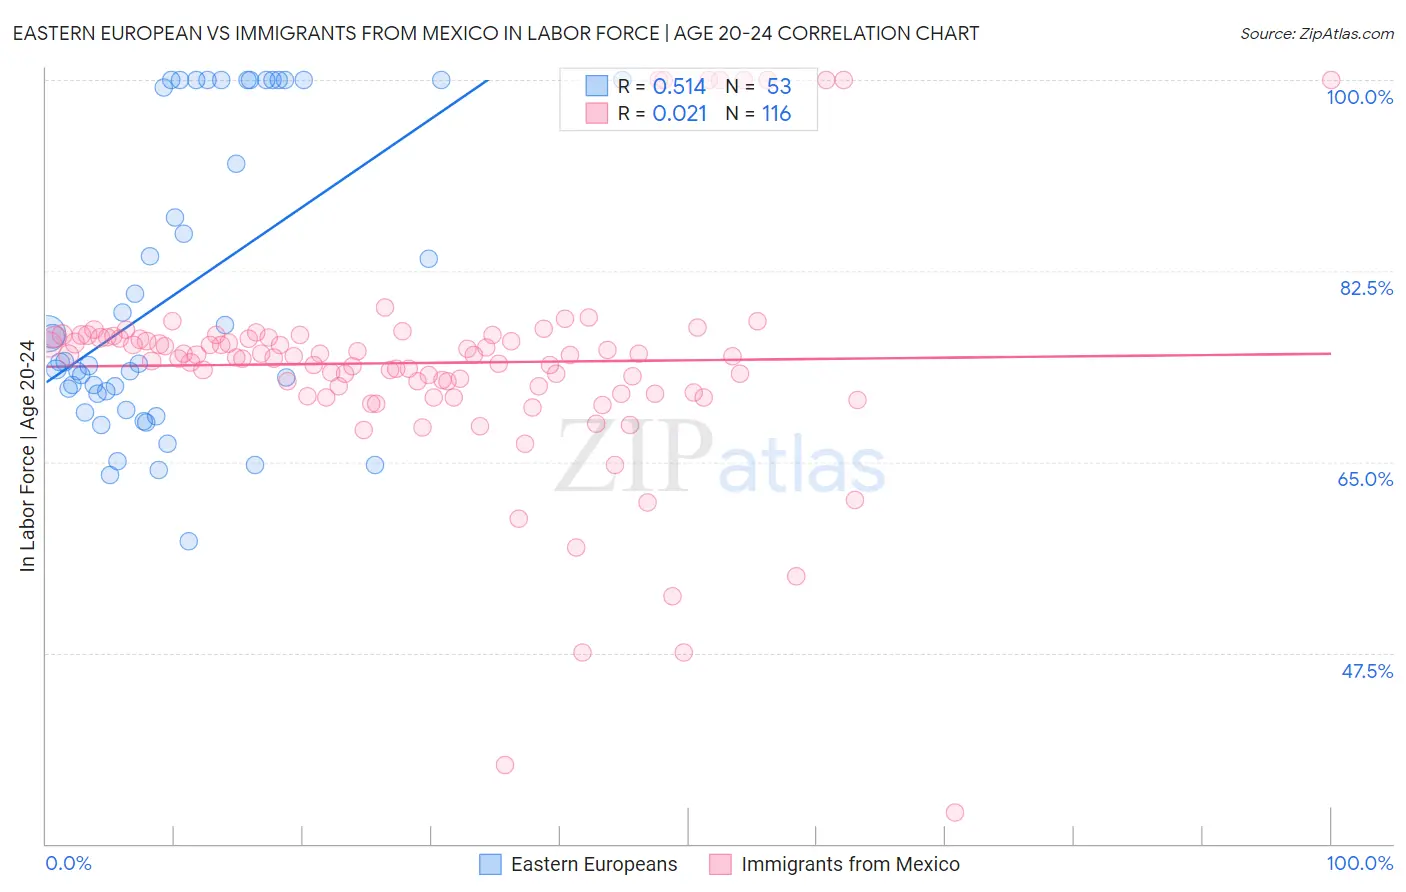
Eastern European vs Immigrants from Mexico In Labor Force | Age 20-24 Correlation Chart
The statistical analysis conducted on geographies consisting of 460,874,706 people shows a substantial positive correlation between the proportion of Eastern Europeans and labor force participation rate among population between the ages 20 and 24 in the United States with a correlation coefficient (R) of 0.514 and weighted average of 74.8%. Similarly, the statistical analysis conducted on geographies consisting of 513,104,206 people shows no correlation between the proportion of Immigrants from Mexico and labor force participation rate among population between the ages 20 and 24 in the United States with a correlation coefficient (R) of 0.021 and weighted average of 75.0%, a difference of 0.36%.
In Labor Force | Age 20-24 Correlation Summary
| Measurement | Eastern European | Immigrants from Mexico |
| Minimum | 57.7% | 32.9% |
| Maximum | 100.0% | 100.0% |
| Range | 42.3% | 67.1% |
| Mean | 80.7% | 74.1% |
| Median | 74.1% | 74.7% |
| Interquartile 25% (IQ1) | 70.5% | 71.3% |
| Interquartile 75% (IQ3) | 100.0% | 76.4% |
| Interquartile Range (IQR) | 29.5% | 5.1% |
| Standard Deviation (Sample) | 13.6% | 10.6% |
| Standard Deviation (Population) | 13.5% | 10.6% |
Demographics Similar to Eastern Europeans and Immigrants from Mexico by In Labor Force | Age 20-24
In terms of in labor force | age 20-24, the demographic groups most similar to Eastern Europeans are Immigrants from Denmark (74.8%, a difference of 0.010%), Immigrants from Vietnam (74.7%, a difference of 0.010%), Alsatian (74.8%, a difference of 0.030%), Immigrants from Europe (74.8%, a difference of 0.040%), and Senegalese (74.8%, a difference of 0.050%). Similarly, the demographic groups most similar to Immigrants from Mexico are Central American (75.0%, a difference of 0.010%), Immigrants from Central America (75.0%, a difference of 0.040%), Immigrants from Latvia (75.0%, a difference of 0.060%), Immigrants from Czechoslovakia (75.0%, a difference of 0.060%), and African (75.0%, a difference of 0.080%).
| Demographics | Rating | Rank | In Labor Force | Age 20-24 |
| Central Americans | 48.7 /100 | #176 | Average 75.0% |
| Immigrants | Mexico | 47.8 /100 | #177 | Average 75.0% |
| Immigrants | Central America | 45.0 /100 | #178 | Average 75.0% |
| Immigrants | Latvia | 44.1 /100 | #179 | Average 75.0% |
| Immigrants | Czechoslovakia | 44.0 /100 | #180 | Average 75.0% |
| Africans | 42.5 /100 | #181 | Average 75.0% |
| Immigrants | South Africa | 36.9 /100 | #182 | Fair 74.9% |
| Immigrants | Costa Rica | 36.7 /100 | #183 | Fair 74.9% |
| Immigrants | Hungary | 35.0 /100 | #184 | Fair 74.9% |
| Sri Lankans | 34.9 /100 | #185 | Fair 74.9% |
| Immigrants | Eastern Europe | 33.8 /100 | #186 | Fair 74.9% |
| Immigrants | Honduras | 33.5 /100 | #187 | Fair 74.9% |
| Hondurans | 32.7 /100 | #188 | Fair 74.8% |
| Immigrants | Northern Europe | 32.6 /100 | #189 | Fair 74.8% |
| Russians | 32.2 /100 | #190 | Fair 74.8% |
| Senegalese | 28.1 /100 | #191 | Fair 74.8% |
| Immigrants | Europe | 27.5 /100 | #192 | Fair 74.8% |
| Alsatians | 27.1 /100 | #193 | Fair 74.8% |
| Immigrants | Denmark | 25.8 /100 | #194 | Fair 74.8% |
| Eastern Europeans | 25.4 /100 | #195 | Fair 74.8% |
| Immigrants | Vietnam | 25.1 /100 | #196 | Fair 74.7% |