Eastern European vs Irish Male Poverty
COMPARE
Eastern European
Irish
Male Poverty
Male Poverty Comparison
Eastern Europeans
Irish
9.6%
MALE POVERTY
99.6/ 100
METRIC RATING
25th/ 347
METRIC RANK
10.3%
MALE POVERTY
96.8/ 100
METRIC RATING
78th/ 347
METRIC RANK
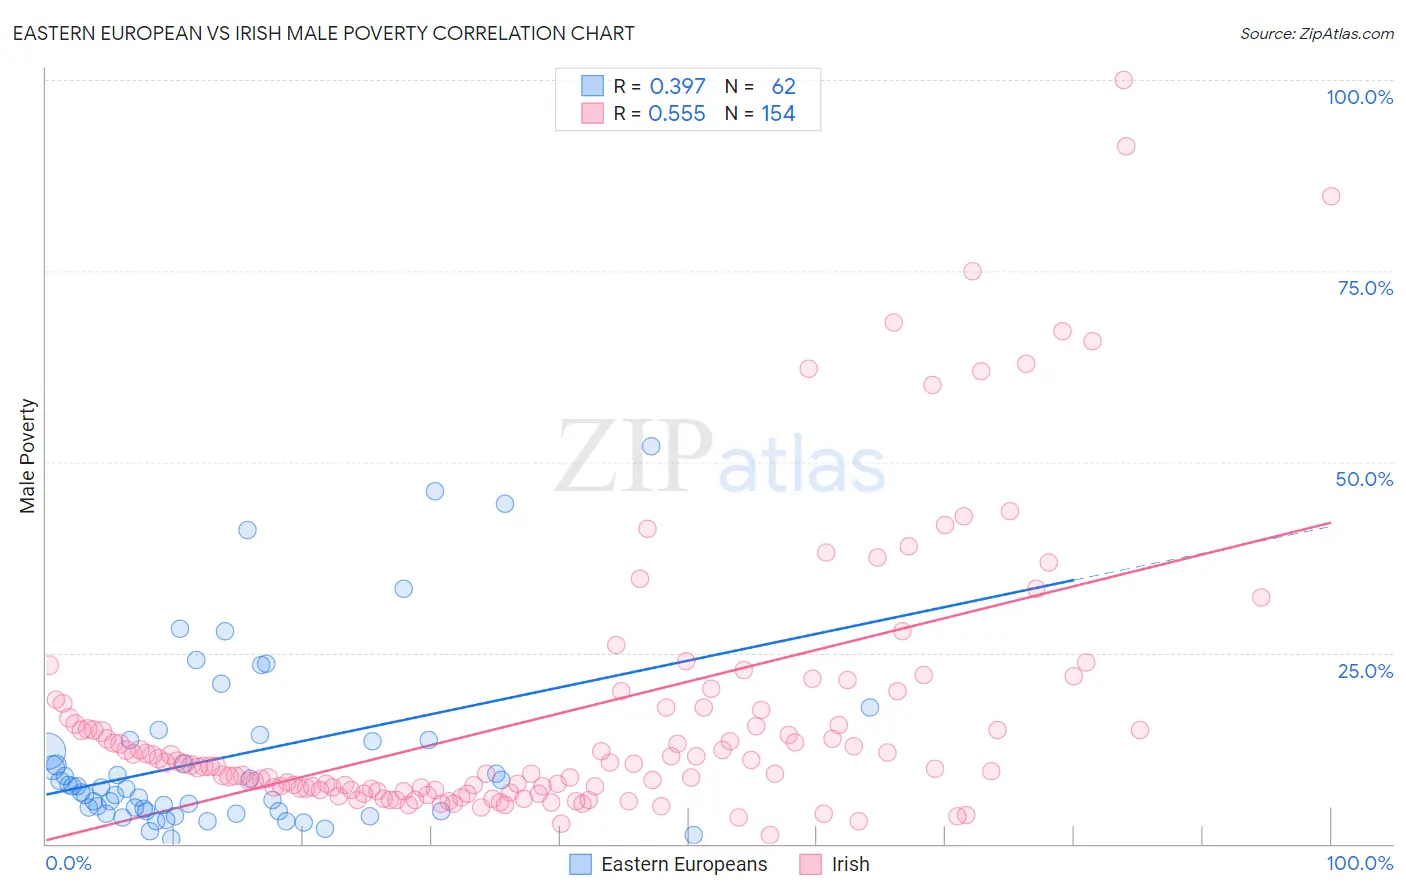
Eastern European vs Irish Male Poverty Correlation Chart
The statistical analysis conducted on geographies consisting of 460,627,341 people shows a mild positive correlation between the proportion of Eastern Europeans and poverty level among males in the United States with a correlation coefficient (R) of 0.397 and weighted average of 9.6%. Similarly, the statistical analysis conducted on geographies consisting of 578,330,947 people shows a substantial positive correlation between the proportion of Irish and poverty level among males in the United States with a correlation coefficient (R) of 0.555 and weighted average of 10.3%, a difference of 6.4%.
Male Poverty Correlation Summary
| Measurement | Eastern European | Irish |
| Minimum | 0.67% | 1.2% |
| Maximum | 52.0% | 100.0% |
| Range | 51.3% | 98.8% |
| Mean | 11.4% | 17.0% |
| Median | 7.3% | 10.4% |
| Interquartile 25% (IQ1) | 4.3% | 7.0% |
| Interquartile 75% (IQ3) | 13.5% | 17.8% |
| Interquartile Range (IQR) | 9.3% | 10.8% |
| Standard Deviation (Sample) | 11.6% | 18.1% |
| Standard Deviation (Population) | 11.5% | 18.1% |
Similar Demographics by Male Poverty
Demographics Similar to Eastern Europeans by Male Poverty
In terms of male poverty, the demographic groups most similar to Eastern Europeans are Swedish (9.6%, a difference of 0.14%), Italian (9.6%, a difference of 0.22%), Croatian (9.6%, a difference of 0.23%), Burmese (9.7%, a difference of 0.44%), and Immigrants from Scotland (9.6%, a difference of 0.48%).
| Demographics | Rating | Rank | Male Poverty |
| Lithuanians | 99.8 /100 | #18 | Exceptional 9.5% |
| Immigrants | Hong Kong | 99.7 /100 | #19 | Exceptional 9.6% |
| Latvians | 99.7 /100 | #20 | Exceptional 9.6% |
| Immigrants | Scotland | 99.7 /100 | #21 | Exceptional 9.6% |
| Croatians | 99.7 /100 | #22 | Exceptional 9.6% |
| Italians | 99.7 /100 | #23 | Exceptional 9.6% |
| Swedes | 99.7 /100 | #24 | Exceptional 9.6% |
| Eastern Europeans | 99.6 /100 | #25 | Exceptional 9.6% |
| Burmese | 99.6 /100 | #26 | Exceptional 9.7% |
| Danes | 99.6 /100 | #27 | Exceptional 9.7% |
| Immigrants | Korea | 99.6 /100 | #28 | Exceptional 9.7% |
| Greeks | 99.6 /100 | #29 | Exceptional 9.7% |
| Poles | 99.5 /100 | #30 | Exceptional 9.7% |
| Tongans | 99.5 /100 | #31 | Exceptional 9.7% |
| Macedonians | 99.5 /100 | #32 | Exceptional 9.7% |
Demographics Similar to Irish by Male Poverty
In terms of male poverty, the demographic groups most similar to Irish are Immigrants from Belgium (10.3%, a difference of 0.020%), Dutch (10.2%, a difference of 0.050%), Carpatho Rusyn (10.2%, a difference of 0.060%), Immigrants from Eastern Europe (10.2%, a difference of 0.070%), and Immigrants from Asia (10.2%, a difference of 0.14%).
| Demographics | Rating | Rank | Male Poverty |
| Europeans | 97.1 /100 | #71 | Exceptional 10.2% |
| Immigrants | Canada | 97.1 /100 | #72 | Exceptional 10.2% |
| Immigrants | Asia | 97.0 /100 | #73 | Exceptional 10.2% |
| Immigrants | Eastern Europe | 96.9 /100 | #74 | Exceptional 10.2% |
| Carpatho Rusyns | 96.9 /100 | #75 | Exceptional 10.2% |
| Dutch | 96.9 /100 | #76 | Exceptional 10.2% |
| Immigrants | Belgium | 96.8 /100 | #77 | Exceptional 10.3% |
| Irish | 96.8 /100 | #78 | Exceptional 10.3% |
| Immigrants | North America | 96.5 /100 | #79 | Exceptional 10.3% |
| English | 96.4 /100 | #80 | Exceptional 10.3% |
| Belgians | 95.9 /100 | #81 | Exceptional 10.3% |
| Egyptians | 95.9 /100 | #82 | Exceptional 10.3% |
| Immigrants | Sweden | 95.7 /100 | #83 | Exceptional 10.3% |
| Czechoslovakians | 95.6 /100 | #84 | Exceptional 10.3% |
| Immigrants | England | 95.5 /100 | #85 | Exceptional 10.4% |