Eastern European vs Immigrants from Honduras Male Poverty
COMPARE
Eastern European
Immigrants from Honduras
Male Poverty
Male Poverty Comparison
Eastern Europeans
Immigrants from Honduras
9.6%
MALE POVERTY
99.6/ 100
METRIC RATING
25th/ 347
METRIC RANK
14.6%
MALE POVERTY
0.0/ 100
METRIC RATING
314th/ 347
METRIC RANK
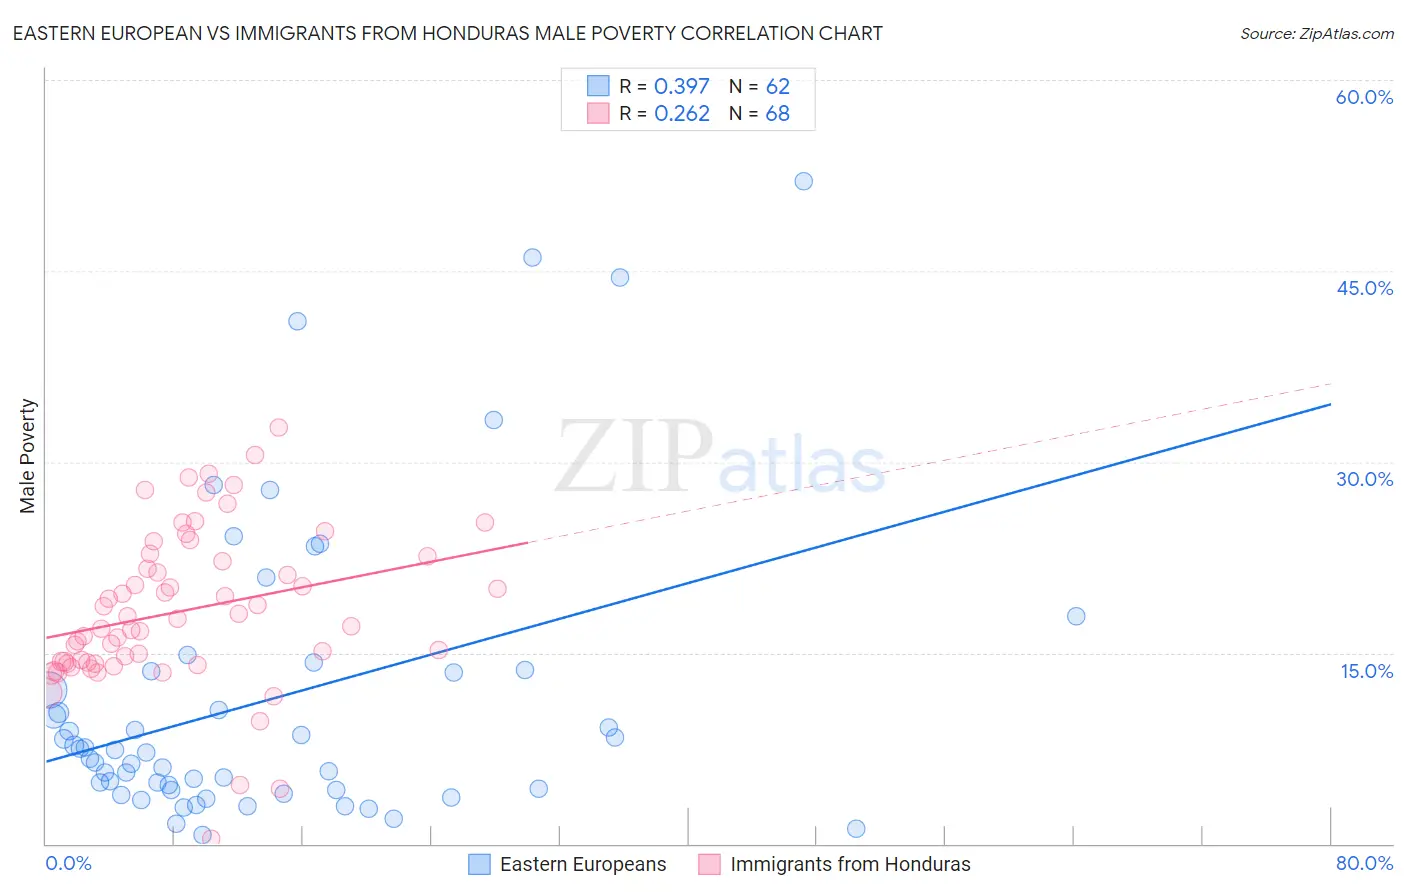
Eastern European vs Immigrants from Honduras Male Poverty Correlation Chart
The statistical analysis conducted on geographies consisting of 460,627,341 people shows a mild positive correlation between the proportion of Eastern Europeans and poverty level among males in the United States with a correlation coefficient (R) of 0.397 and weighted average of 9.6%. Similarly, the statistical analysis conducted on geographies consisting of 322,443,990 people shows a weak positive correlation between the proportion of Immigrants from Honduras and poverty level among males in the United States with a correlation coefficient (R) of 0.262 and weighted average of 14.6%, a difference of 51.3%.
Male Poverty Correlation Summary
| Measurement | Eastern European | Immigrants from Honduras |
| Minimum | 0.67% | 0.43% |
| Maximum | 52.0% | 32.7% |
| Range | 51.3% | 32.3% |
| Mean | 11.4% | 18.3% |
| Median | 7.3% | 17.4% |
| Interquartile 25% (IQ1) | 4.3% | 14.2% |
| Interquartile 75% (IQ3) | 13.5% | 22.3% |
| Interquartile Range (IQR) | 9.3% | 8.1% |
| Standard Deviation (Sample) | 11.6% | 6.2% |
| Standard Deviation (Population) | 11.5% | 6.1% |
Similar Demographics by Male Poverty
Demographics Similar to Eastern Europeans by Male Poverty
In terms of male poverty, the demographic groups most similar to Eastern Europeans are Swedish (9.6%, a difference of 0.14%), Italian (9.6%, a difference of 0.22%), Croatian (9.6%, a difference of 0.23%), Burmese (9.7%, a difference of 0.44%), and Immigrants from Scotland (9.6%, a difference of 0.48%).
| Demographics | Rating | Rank | Male Poverty |
| Lithuanians | 99.8 /100 | #18 | Exceptional 9.5% |
| Immigrants | Hong Kong | 99.7 /100 | #19 | Exceptional 9.6% |
| Latvians | 99.7 /100 | #20 | Exceptional 9.6% |
| Immigrants | Scotland | 99.7 /100 | #21 | Exceptional 9.6% |
| Croatians | 99.7 /100 | #22 | Exceptional 9.6% |
| Italians | 99.7 /100 | #23 | Exceptional 9.6% |
| Swedes | 99.7 /100 | #24 | Exceptional 9.6% |
| Eastern Europeans | 99.6 /100 | #25 | Exceptional 9.6% |
| Burmese | 99.6 /100 | #26 | Exceptional 9.7% |
| Danes | 99.6 /100 | #27 | Exceptional 9.7% |
| Immigrants | Korea | 99.6 /100 | #28 | Exceptional 9.7% |
| Greeks | 99.6 /100 | #29 | Exceptional 9.7% |
| Poles | 99.5 /100 | #30 | Exceptional 9.7% |
| Tongans | 99.5 /100 | #31 | Exceptional 9.7% |
| Macedonians | 99.5 /100 | #32 | Exceptional 9.7% |
Demographics Similar to Immigrants from Honduras by Male Poverty
In terms of male poverty, the demographic groups most similar to Immigrants from Honduras are Immigrants from Somalia (14.6%, a difference of 0.040%), Chippewa (14.6%, a difference of 0.080%), British West Indian (14.6%, a difference of 0.10%), Immigrants from Dominica (14.7%, a difference of 0.78%), and Immigrants from Grenada (14.7%, a difference of 0.84%).
| Demographics | Rating | Rank | Male Poverty |
| Dutch West Indians | 0.0 /100 | #307 | Tragic 14.2% |
| Africans | 0.0 /100 | #308 | Tragic 14.2% |
| Somalis | 0.0 /100 | #309 | Tragic 14.3% |
| Seminole | 0.0 /100 | #310 | Tragic 14.3% |
| Hondurans | 0.0 /100 | #311 | Tragic 14.3% |
| Choctaw | 0.0 /100 | #312 | Tragic 14.4% |
| Immigrants | Somalia | 0.0 /100 | #313 | Tragic 14.6% |
| Immigrants | Honduras | 0.0 /100 | #314 | Tragic 14.6% |
| Chippewa | 0.0 /100 | #315 | Tragic 14.6% |
| British West Indians | 0.0 /100 | #316 | Tragic 14.6% |
| Immigrants | Dominica | 0.0 /100 | #317 | Tragic 14.7% |
| Immigrants | Grenada | 0.0 /100 | #318 | Tragic 14.7% |
| U.S. Virgin Islanders | 0.0 /100 | #319 | Tragic 14.7% |
| Immigrants | Congo | 0.0 /100 | #320 | Tragic 14.7% |
| Arapaho | 0.0 /100 | #321 | Tragic 15.1% |