Eastern European vs Immigrants from Mexico Master's Degree
COMPARE
Eastern European
Immigrants from Mexico
Master's Degree
Master's Degree Comparison
Eastern Europeans
Immigrants from Mexico
21.1%
MASTER'S DEGREE
100.0/ 100
METRIC RATING
12th/ 347
METRIC RANK
9.3%
MASTER'S DEGREE
0.0/ 100
METRIC RATING
342nd/ 347
METRIC RANK
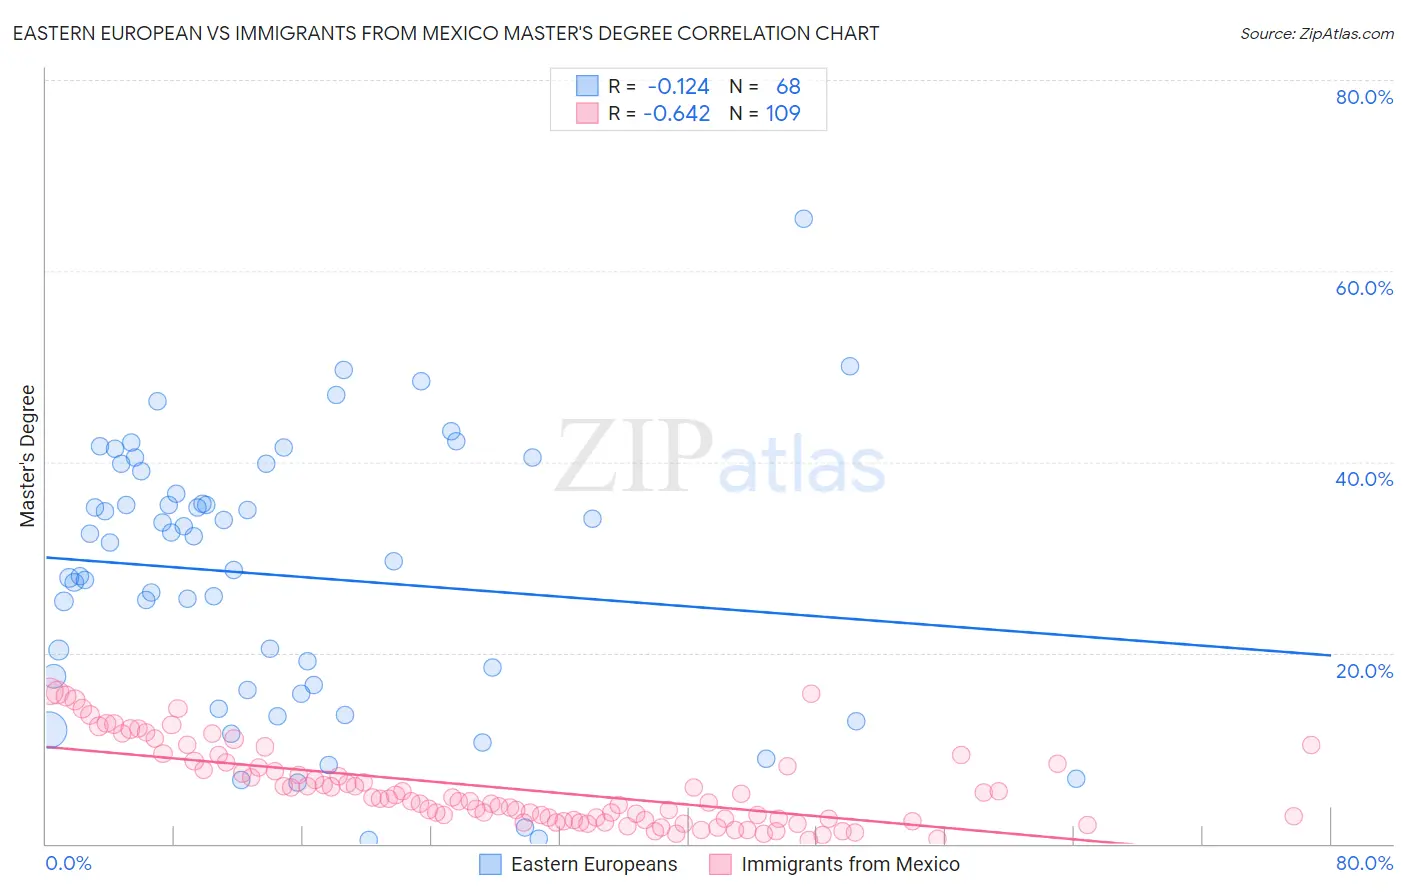
Eastern European vs Immigrants from Mexico Master's Degree Correlation Chart
The statistical analysis conducted on geographies consisting of 461,097,152 people shows a poor negative correlation between the proportion of Eastern Europeans and percentage of population with at least master's degree education in the United States with a correlation coefficient (R) of -0.124 and weighted average of 21.1%. Similarly, the statistical analysis conducted on geographies consisting of 513,107,790 people shows a significant negative correlation between the proportion of Immigrants from Mexico and percentage of population with at least master's degree education in the United States with a correlation coefficient (R) of -0.642 and weighted average of 9.3%, a difference of 126.8%.
Master's Degree Correlation Summary
| Measurement | Eastern European | Immigrants from Mexico |
| Minimum | 0.34% | 0.36% |
| Maximum | 65.5% | 16.0% |
| Range | 65.2% | 15.6% |
| Mean | 28.1% | 5.9% |
| Median | 30.6% | 4.7% |
| Interquartile 25% (IQ1) | 16.4% | 2.6% |
| Interquartile 75% (IQ3) | 37.8% | 8.5% |
| Interquartile Range (IQR) | 21.4% | 5.9% |
| Standard Deviation (Sample) | 13.9% | 4.2% |
| Standard Deviation (Population) | 13.8% | 4.1% |
Similar Demographics by Master's Degree
Demographics Similar to Eastern Europeans by Master's Degree
In terms of master's degree, the demographic groups most similar to Eastern Europeans are Immigrants from China (21.2%, a difference of 0.32%), Immigrants from Australia (20.9%, a difference of 1.2%), Immigrants from Switzerland (20.9%, a difference of 1.2%), Immigrants from Eastern Asia (20.8%, a difference of 1.4%), and Immigrants from Belgium (20.8%, a difference of 1.7%).
| Demographics | Rating | Rank | Master's Degree |
| Immigrants | Taiwan | 100.0 /100 | #5 | Exceptional 22.5% |
| Immigrants | India | 100.0 /100 | #6 | Exceptional 22.3% |
| Iranians | 100.0 /100 | #7 | Exceptional 22.3% |
| Cypriots | 100.0 /100 | #8 | Exceptional 21.8% |
| Thais | 100.0 /100 | #9 | Exceptional 21.7% |
| Immigrants | Iran | 100.0 /100 | #10 | Exceptional 21.6% |
| Immigrants | China | 100.0 /100 | #11 | Exceptional 21.2% |
| Eastern Europeans | 100.0 /100 | #12 | Exceptional 21.1% |
| Immigrants | Australia | 100.0 /100 | #13 | Exceptional 20.9% |
| Immigrants | Switzerland | 100.0 /100 | #14 | Exceptional 20.9% |
| Immigrants | Eastern Asia | 100.0 /100 | #15 | Exceptional 20.8% |
| Immigrants | Belgium | 100.0 /100 | #16 | Exceptional 20.8% |
| Immigrants | South Central Asia | 100.0 /100 | #17 | Exceptional 20.7% |
| Soviet Union | 100.0 /100 | #18 | Exceptional 20.5% |
| Immigrants | Hong Kong | 100.0 /100 | #19 | Exceptional 20.5% |
Demographics Similar to Immigrants from Mexico by Master's Degree
In terms of master's degree, the demographic groups most similar to Immigrants from Mexico are Lumbee (9.3%, a difference of 0.48%), Pima (9.2%, a difference of 0.65%), Yuman (9.2%, a difference of 0.81%), Navajo (9.4%, a difference of 1.3%), and Yakama (9.5%, a difference of 1.6%).
| Demographics | Rating | Rank | Master's Degree |
| Menominee | 0.0 /100 | #333 | Tragic 10.2% |
| Arapaho | 0.0 /100 | #334 | Tragic 10.0% |
| Immigrants | Central America | 0.0 /100 | #335 | Tragic 10.0% |
| Natives/Alaskans | 0.0 /100 | #336 | Tragic 9.9% |
| Mexicans | 0.0 /100 | #337 | Tragic 9.7% |
| Tohono O'odham | 0.0 /100 | #338 | Tragic 9.7% |
| Spanish American Indians | 0.0 /100 | #339 | Tragic 9.6% |
| Yakama | 0.0 /100 | #340 | Tragic 9.5% |
| Navajo | 0.0 /100 | #341 | Tragic 9.4% |
| Immigrants | Mexico | 0.0 /100 | #342 | Tragic 9.3% |
| Lumbee | 0.0 /100 | #343 | Tragic 9.3% |
| Pima | 0.0 /100 | #344 | Tragic 9.2% |
| Yuman | 0.0 /100 | #345 | Tragic 9.2% |
| Yup'ik | 0.0 /100 | #346 | Tragic 8.5% |
| Houma | 0.0 /100 | #347 | Tragic 7.9% |