Eastern European vs Shoshone Male Poverty
COMPARE
Eastern European
Shoshone
Male Poverty
Male Poverty Comparison
Eastern Europeans
Shoshone
9.6%
MALE POVERTY
99.6/ 100
METRIC RATING
25th/ 347
METRIC RANK
13.8%
MALE POVERTY
0.0/ 100
METRIC RATING
286th/ 347
METRIC RANK
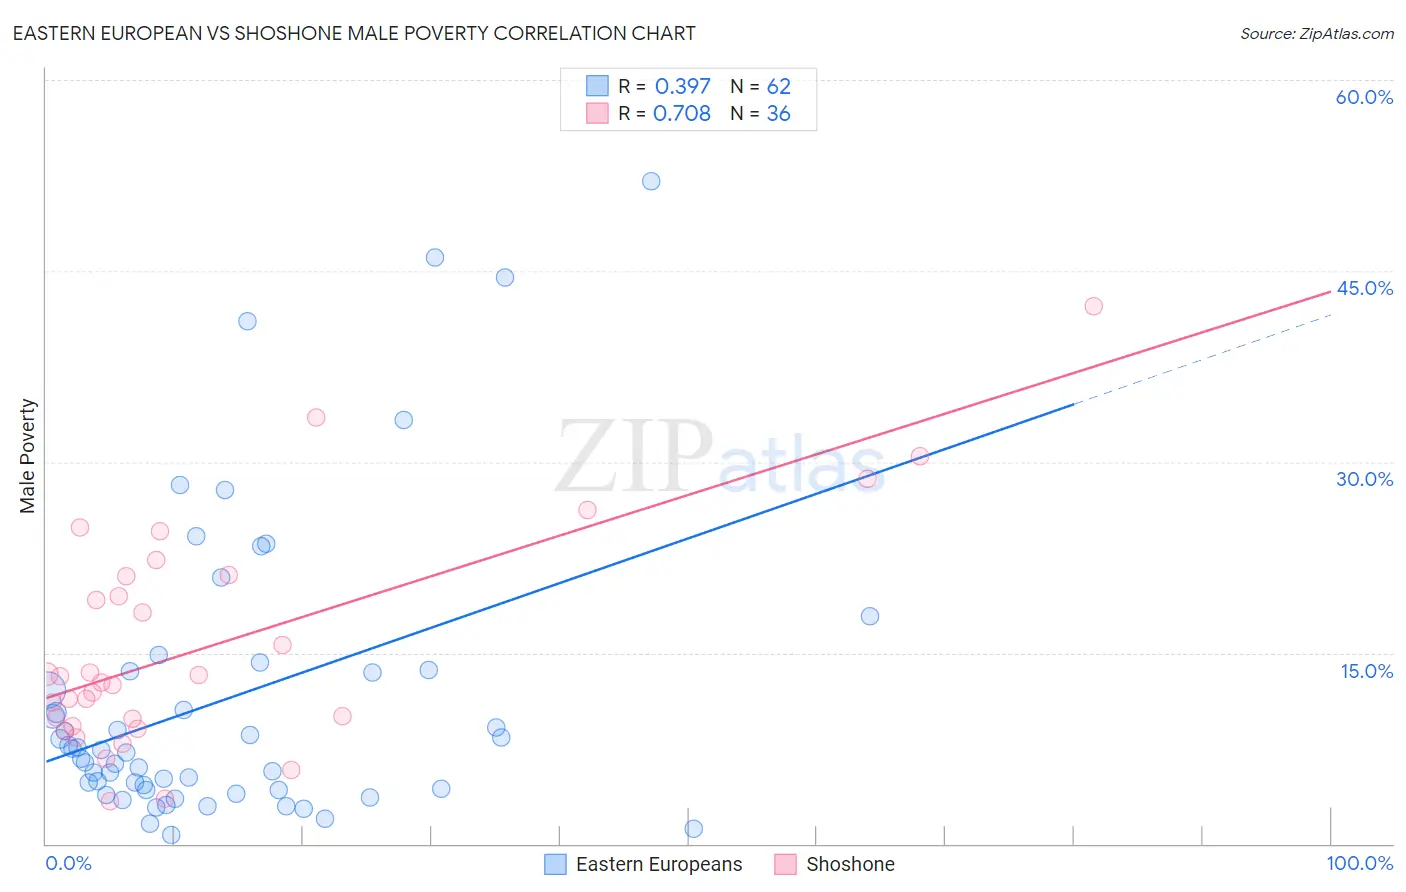
Eastern European vs Shoshone Male Poverty Correlation Chart
The statistical analysis conducted on geographies consisting of 460,627,341 people shows a mild positive correlation between the proportion of Eastern Europeans and poverty level among males in the United States with a correlation coefficient (R) of 0.397 and weighted average of 9.6%. Similarly, the statistical analysis conducted on geographies consisting of 66,615,440 people shows a strong positive correlation between the proportion of Shoshone and poverty level among males in the United States with a correlation coefficient (R) of 0.708 and weighted average of 13.8%, a difference of 42.7%.
Male Poverty Correlation Summary
| Measurement | Eastern European | Shoshone |
| Minimum | 0.67% | 3.3% |
| Maximum | 52.0% | 42.2% |
| Range | 51.3% | 38.9% |
| Mean | 11.4% | 15.7% |
| Median | 7.3% | 12.9% |
| Interquartile 25% (IQ1) | 4.3% | 9.5% |
| Interquartile 75% (IQ3) | 13.5% | 21.1% |
| Interquartile Range (IQR) | 9.3% | 11.5% |
| Standard Deviation (Sample) | 11.6% | 8.9% |
| Standard Deviation (Population) | 11.5% | 8.8% |
Similar Demographics by Male Poverty
Demographics Similar to Eastern Europeans by Male Poverty
In terms of male poverty, the demographic groups most similar to Eastern Europeans are Swedish (9.6%, a difference of 0.14%), Italian (9.6%, a difference of 0.22%), Croatian (9.6%, a difference of 0.23%), Burmese (9.7%, a difference of 0.44%), and Immigrants from Scotland (9.6%, a difference of 0.48%).
| Demographics | Rating | Rank | Male Poverty |
| Lithuanians | 99.8 /100 | #18 | Exceptional 9.5% |
| Immigrants | Hong Kong | 99.7 /100 | #19 | Exceptional 9.6% |
| Latvians | 99.7 /100 | #20 | Exceptional 9.6% |
| Immigrants | Scotland | 99.7 /100 | #21 | Exceptional 9.6% |
| Croatians | 99.7 /100 | #22 | Exceptional 9.6% |
| Italians | 99.7 /100 | #23 | Exceptional 9.6% |
| Swedes | 99.7 /100 | #24 | Exceptional 9.6% |
| Eastern Europeans | 99.6 /100 | #25 | Exceptional 9.6% |
| Burmese | 99.6 /100 | #26 | Exceptional 9.7% |
| Danes | 99.6 /100 | #27 | Exceptional 9.7% |
| Immigrants | Korea | 99.6 /100 | #28 | Exceptional 9.7% |
| Greeks | 99.6 /100 | #29 | Exceptional 9.7% |
| Poles | 99.5 /100 | #30 | Exceptional 9.7% |
| Tongans | 99.5 /100 | #31 | Exceptional 9.7% |
| Macedonians | 99.5 /100 | #32 | Exceptional 9.7% |
Demographics Similar to Shoshone by Male Poverty
In terms of male poverty, the demographic groups most similar to Shoshone are Immigrants from Barbados (13.8%, a difference of 0.020%), West Indian (13.8%, a difference of 0.030%), Immigrants from Haiti (13.8%, a difference of 0.040%), Comanche (13.8%, a difference of 0.050%), and Immigrants from St. Vincent and the Grenadines (13.8%, a difference of 0.18%).
| Demographics | Rating | Rank | Male Poverty |
| Haitians | 0.0 /100 | #279 | Tragic 13.7% |
| Mexicans | 0.0 /100 | #280 | Tragic 13.7% |
| Yaqui | 0.0 /100 | #281 | Tragic 13.7% |
| Immigrants | Cabo Verde | 0.0 /100 | #282 | Tragic 13.7% |
| Comanche | 0.0 /100 | #283 | Tragic 13.8% |
| Immigrants | Haiti | 0.0 /100 | #284 | Tragic 13.8% |
| West Indians | 0.0 /100 | #285 | Tragic 13.8% |
| Shoshone | 0.0 /100 | #286 | Tragic 13.8% |
| Immigrants | Barbados | 0.0 /100 | #287 | Tragic 13.8% |
| Immigrants | St. Vincent and the Grenadines | 0.0 /100 | #288 | Tragic 13.8% |
| Guatemalans | 0.0 /100 | #289 | Tragic 13.8% |
| Immigrants | Zaire | 0.0 /100 | #290 | Tragic 13.8% |
| Vietnamese | 0.0 /100 | #291 | Tragic 13.8% |
| Indonesians | 0.0 /100 | #292 | Tragic 13.8% |
| Immigrants | Belize | 0.0 /100 | #293 | Tragic 13.8% |