Eastern European vs Ecuadorian Female Poverty Among 25-34 Year Olds
COMPARE
Eastern European
Ecuadorian
Female Poverty Among 25-34 Year Olds
Female Poverty Among 25-34 Year Olds Comparison
Eastern Europeans
Ecuadorians
12.0%
FEMALE POVERTY AMONG 25-34 YEAR OLDS
99.6/ 100
METRIC RATING
54th/ 347
METRIC RANK
14.3%
FEMALE POVERTY AMONG 25-34 YEAR OLDS
5.2/ 100
METRIC RATING
219th/ 347
METRIC RANK
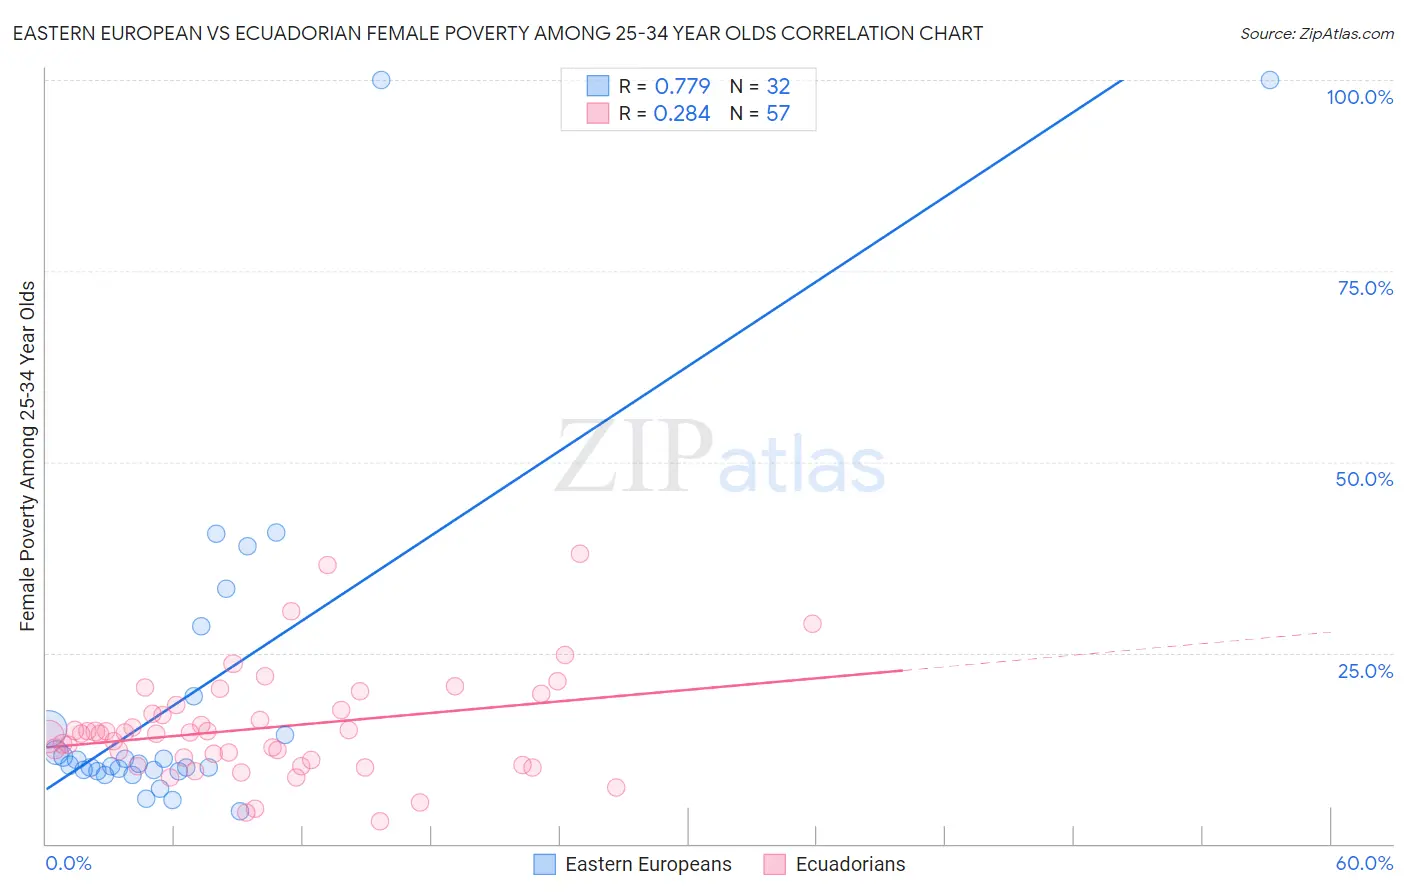
Eastern European vs Ecuadorian Female Poverty Among 25-34 Year Olds Correlation Chart
The statistical analysis conducted on geographies consisting of 449,003,050 people shows a strong positive correlation between the proportion of Eastern Europeans and poverty level among females between the ages 25 and 34 in the United States with a correlation coefficient (R) of 0.779 and weighted average of 12.0%. Similarly, the statistical analysis conducted on geographies consisting of 313,777,043 people shows a weak positive correlation between the proportion of Ecuadorians and poverty level among females between the ages 25 and 34 in the United States with a correlation coefficient (R) of 0.284 and weighted average of 14.3%, a difference of 19.5%.
Female Poverty Among 25-34 Year Olds Correlation Summary
| Measurement | Eastern European | Ecuadorian |
| Minimum | 4.3% | 2.9% |
| Maximum | 100.0% | 38.0% |
| Range | 95.7% | 35.1% |
| Mean | 19.9% | 15.1% |
| Median | 10.4% | 14.5% |
| Interquartile 25% (IQ1) | 9.6% | 10.6% |
| Interquartile 75% (IQ3) | 17.2% | 17.8% |
| Interquartile Range (IQR) | 7.6% | 7.2% |
| Standard Deviation (Sample) | 23.3% | 7.0% |
| Standard Deviation (Population) | 23.0% | 6.9% |
Similar Demographics by Female Poverty Among 25-34 Year Olds
Demographics Similar to Eastern Europeans by Female Poverty Among 25-34 Year Olds
In terms of female poverty among 25-34 year olds, the demographic groups most similar to Eastern Europeans are Immigrants from Israel (12.0%, a difference of 0.12%), Immigrants from Philippines (12.0%, a difference of 0.17%), Immigrants from Eastern Europe (12.0%, a difference of 0.24%), Paraguayan (12.0%, a difference of 0.26%), and Immigrants from Croatia (12.0%, a difference of 0.27%).
| Demographics | Rating | Rank | Female Poverty Among 25-34 Year Olds |
| Koreans | 99.6 /100 | #47 | Exceptional 12.0% |
| Immigrants | Belarus | 99.6 /100 | #48 | Exceptional 12.0% |
| Immigrants | Egypt | 99.6 /100 | #49 | Exceptional 12.0% |
| Immigrants | Croatia | 99.6 /100 | #50 | Exceptional 12.0% |
| Paraguayans | 99.6 /100 | #51 | Exceptional 12.0% |
| Immigrants | Eastern Europe | 99.6 /100 | #52 | Exceptional 12.0% |
| Immigrants | Israel | 99.6 /100 | #53 | Exceptional 12.0% |
| Eastern Europeans | 99.6 /100 | #54 | Exceptional 12.0% |
| Immigrants | Philippines | 99.5 /100 | #55 | Exceptional 12.0% |
| Luxembourgers | 99.5 /100 | #56 | Exceptional 12.1% |
| Jordanians | 99.4 /100 | #57 | Exceptional 12.1% |
| Immigrants | Romania | 99.4 /100 | #58 | Exceptional 12.1% |
| Russians | 99.4 /100 | #59 | Exceptional 12.1% |
| Immigrants | Northern Europe | 99.4 /100 | #60 | Exceptional 12.1% |
| Immigrants | Czechoslovakia | 99.4 /100 | #61 | Exceptional 12.1% |
Demographics Similar to Ecuadorians by Female Poverty Among 25-34 Year Olds
In terms of female poverty among 25-34 year olds, the demographic groups most similar to Ecuadorians are Immigrants from Thailand (14.3%, a difference of 0.0%), Spanish American Indian (14.3%, a difference of 0.11%), French Canadian (14.3%, a difference of 0.12%), Ghanaian (14.4%, a difference of 0.16%), and Sudanese (14.4%, a difference of 0.32%).
| Demographics | Rating | Rank | Female Poverty Among 25-34 Year Olds |
| Immigrants | Guyana | 6.6 /100 | #212 | Tragic 14.3% |
| Puget Sound Salish | 6.5 /100 | #213 | Tragic 14.3% |
| French | 6.2 /100 | #214 | Tragic 14.3% |
| Immigrants | Nigeria | 6.2 /100 | #215 | Tragic 14.3% |
| French Canadians | 5.5 /100 | #216 | Tragic 14.3% |
| Spanish American Indians | 5.5 /100 | #217 | Tragic 14.3% |
| Immigrants | Thailand | 5.2 /100 | #218 | Tragic 14.3% |
| Ecuadorians | 5.2 /100 | #219 | Tragic 14.3% |
| Ghanaians | 4.8 /100 | #220 | Tragic 14.4% |
| Sudanese | 4.4 /100 | #221 | Tragic 14.4% |
| Immigrants | Portugal | 4.3 /100 | #222 | Tragic 14.4% |
| Nigerians | 4.2 /100 | #223 | Tragic 14.4% |
| Immigrants | Sudan | 4.0 /100 | #224 | Tragic 14.4% |
| Immigrants | Barbados | 3.4 /100 | #225 | Tragic 14.5% |
| Nicaraguans | 3.3 /100 | #226 | Tragic 14.5% |