Eastern European vs Chilean Female Poverty Among 25-34 Year Olds
COMPARE
Eastern European
Chilean
Female Poverty Among 25-34 Year Olds
Female Poverty Among 25-34 Year Olds Comparison
Eastern Europeans
Chileans
12.0%
FEMALE POVERTY AMONG 25-34 YEAR OLDS
99.6/ 100
METRIC RATING
54th/ 347
METRIC RANK
12.8%
FEMALE POVERTY AMONG 25-34 YEAR OLDS
93.2/ 100
METRIC RATING
116th/ 347
METRIC RANK
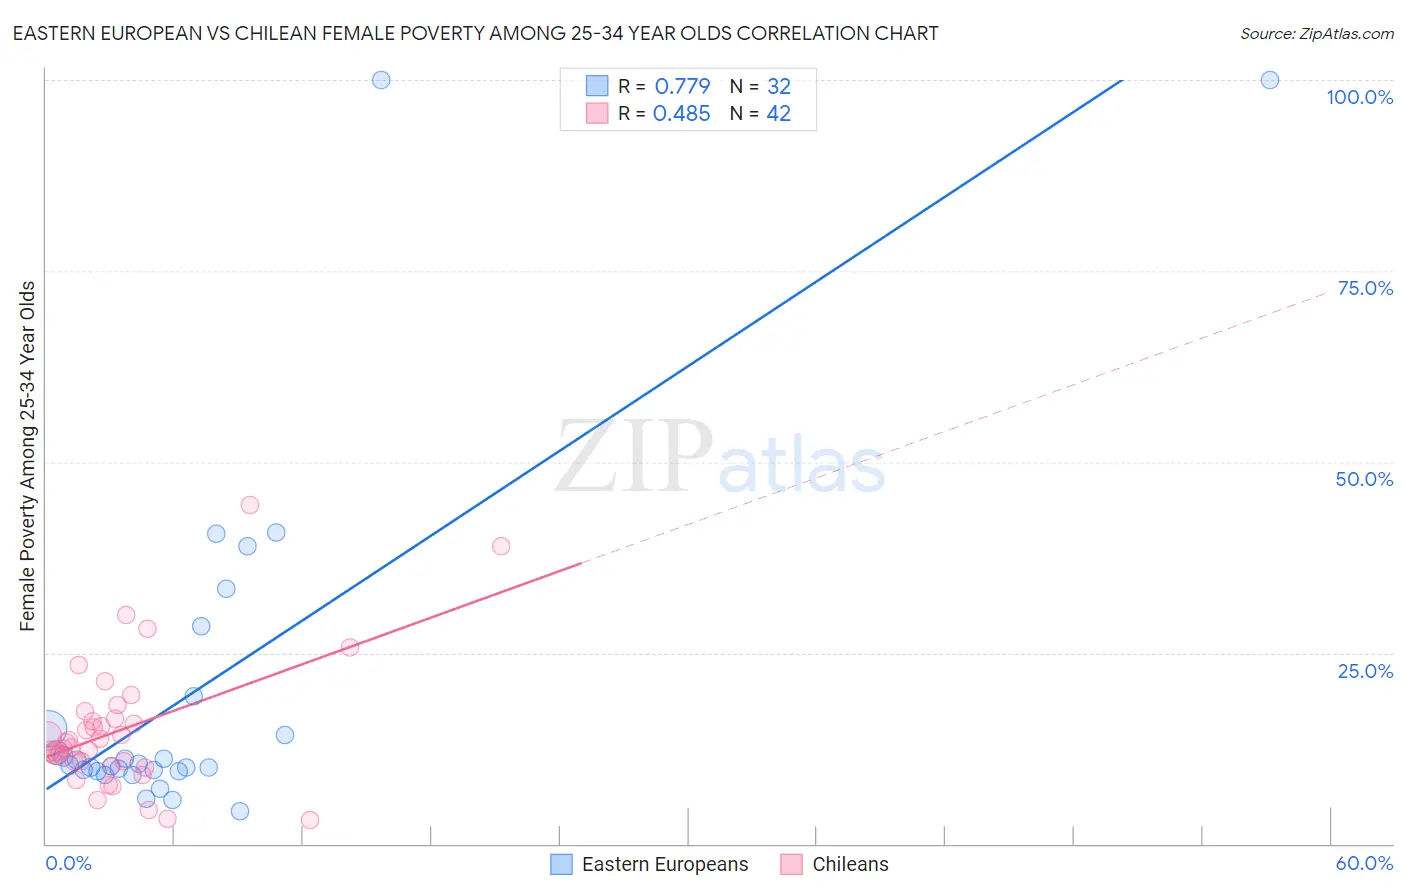
Eastern European vs Chilean Female Poverty Among 25-34 Year Olds Correlation Chart
The statistical analysis conducted on geographies consisting of 449,003,050 people shows a strong positive correlation between the proportion of Eastern Europeans and poverty level among females between the ages 25 and 34 in the United States with a correlation coefficient (R) of 0.779 and weighted average of 12.0%. Similarly, the statistical analysis conducted on geographies consisting of 254,171,543 people shows a moderate positive correlation between the proportion of Chileans and poverty level among females between the ages 25 and 34 in the United States with a correlation coefficient (R) of 0.485 and weighted average of 12.8%, a difference of 6.5%.
Female Poverty Among 25-34 Year Olds Correlation Summary
| Measurement | Eastern European | Chilean |
| Minimum | 4.3% | 3.1% |
| Maximum | 100.0% | 44.3% |
| Range | 95.7% | 41.2% |
| Mean | 19.9% | 14.9% |
| Median | 10.4% | 12.9% |
| Interquartile 25% (IQ1) | 9.6% | 10.8% |
| Interquartile 75% (IQ3) | 17.2% | 16.3% |
| Interquartile Range (IQR) | 7.6% | 5.5% |
| Standard Deviation (Sample) | 23.3% | 8.5% |
| Standard Deviation (Population) | 23.0% | 8.4% |
Similar Demographics by Female Poverty Among 25-34 Year Olds
Demographics Similar to Eastern Europeans by Female Poverty Among 25-34 Year Olds
In terms of female poverty among 25-34 year olds, the demographic groups most similar to Eastern Europeans are Immigrants from Israel (12.0%, a difference of 0.12%), Immigrants from Philippines (12.0%, a difference of 0.17%), Immigrants from Eastern Europe (12.0%, a difference of 0.24%), Paraguayan (12.0%, a difference of 0.26%), and Immigrants from Croatia (12.0%, a difference of 0.27%).
| Demographics | Rating | Rank | Female Poverty Among 25-34 Year Olds |
| Koreans | 99.6 /100 | #47 | Exceptional 12.0% |
| Immigrants | Belarus | 99.6 /100 | #48 | Exceptional 12.0% |
| Immigrants | Egypt | 99.6 /100 | #49 | Exceptional 12.0% |
| Immigrants | Croatia | 99.6 /100 | #50 | Exceptional 12.0% |
| Paraguayans | 99.6 /100 | #51 | Exceptional 12.0% |
| Immigrants | Eastern Europe | 99.6 /100 | #52 | Exceptional 12.0% |
| Immigrants | Israel | 99.6 /100 | #53 | Exceptional 12.0% |
| Eastern Europeans | 99.6 /100 | #54 | Exceptional 12.0% |
| Immigrants | Philippines | 99.5 /100 | #55 | Exceptional 12.0% |
| Luxembourgers | 99.5 /100 | #56 | Exceptional 12.1% |
| Jordanians | 99.4 /100 | #57 | Exceptional 12.1% |
| Immigrants | Romania | 99.4 /100 | #58 | Exceptional 12.1% |
| Russians | 99.4 /100 | #59 | Exceptional 12.1% |
| Immigrants | Northern Europe | 99.4 /100 | #60 | Exceptional 12.1% |
| Immigrants | Czechoslovakia | 99.4 /100 | #61 | Exceptional 12.1% |
Demographics Similar to Chileans by Female Poverty Among 25-34 Year Olds
In terms of female poverty among 25-34 year olds, the demographic groups most similar to Chileans are Immigrants from Brazil (12.8%, a difference of 0.030%), Immigrants from Kuwait (12.8%, a difference of 0.060%), Mongolian (12.8%, a difference of 0.070%), Immigrants from Nepal (12.8%, a difference of 0.080%), and Carpatho Rusyn (12.8%, a difference of 0.090%).
| Demographics | Rating | Rank | Female Poverty Among 25-34 Year Olds |
| Immigrants | Peru | 94.3 /100 | #109 | Exceptional 12.7% |
| Australians | 94.1 /100 | #110 | Exceptional 12.8% |
| Danes | 93.9 /100 | #111 | Exceptional 12.8% |
| Immigrants | Morocco | 93.9 /100 | #112 | Exceptional 12.8% |
| Immigrants | Syria | 93.8 /100 | #113 | Exceptional 12.8% |
| Immigrants | Southern Europe | 93.6 /100 | #114 | Exceptional 12.8% |
| Immigrants | Brazil | 93.3 /100 | #115 | Exceptional 12.8% |
| Chileans | 93.2 /100 | #116 | Exceptional 12.8% |
| Immigrants | Kuwait | 93.1 /100 | #117 | Exceptional 12.8% |
| Mongolians | 93.0 /100 | #118 | Exceptional 12.8% |
| Immigrants | Nepal | 93.0 /100 | #119 | Exceptional 12.8% |
| Carpatho Rusyns | 93.0 /100 | #120 | Exceptional 12.8% |
| Romanians | 92.8 /100 | #121 | Exceptional 12.8% |
| Immigrants | Western Asia | 92.7 /100 | #122 | Exceptional 12.8% |
| Slovenes | 92.7 /100 | #123 | Exceptional 12.8% |