Dutch vs Black/African American Female Poverty Among 25-34 Year Olds
COMPARE
Dutch
Black/African American
Female Poverty Among 25-34 Year Olds
Female Poverty Among 25-34 Year Olds Comparison
Dutch
Blacks/African Americans
13.8%
FEMALE POVERTY AMONG 25-34 YEAR OLDS
29.7/ 100
METRIC RATING
190th/ 347
METRIC RANK
18.9%
FEMALE POVERTY AMONG 25-34 YEAR OLDS
0.0/ 100
METRIC RATING
326th/ 347
METRIC RANK
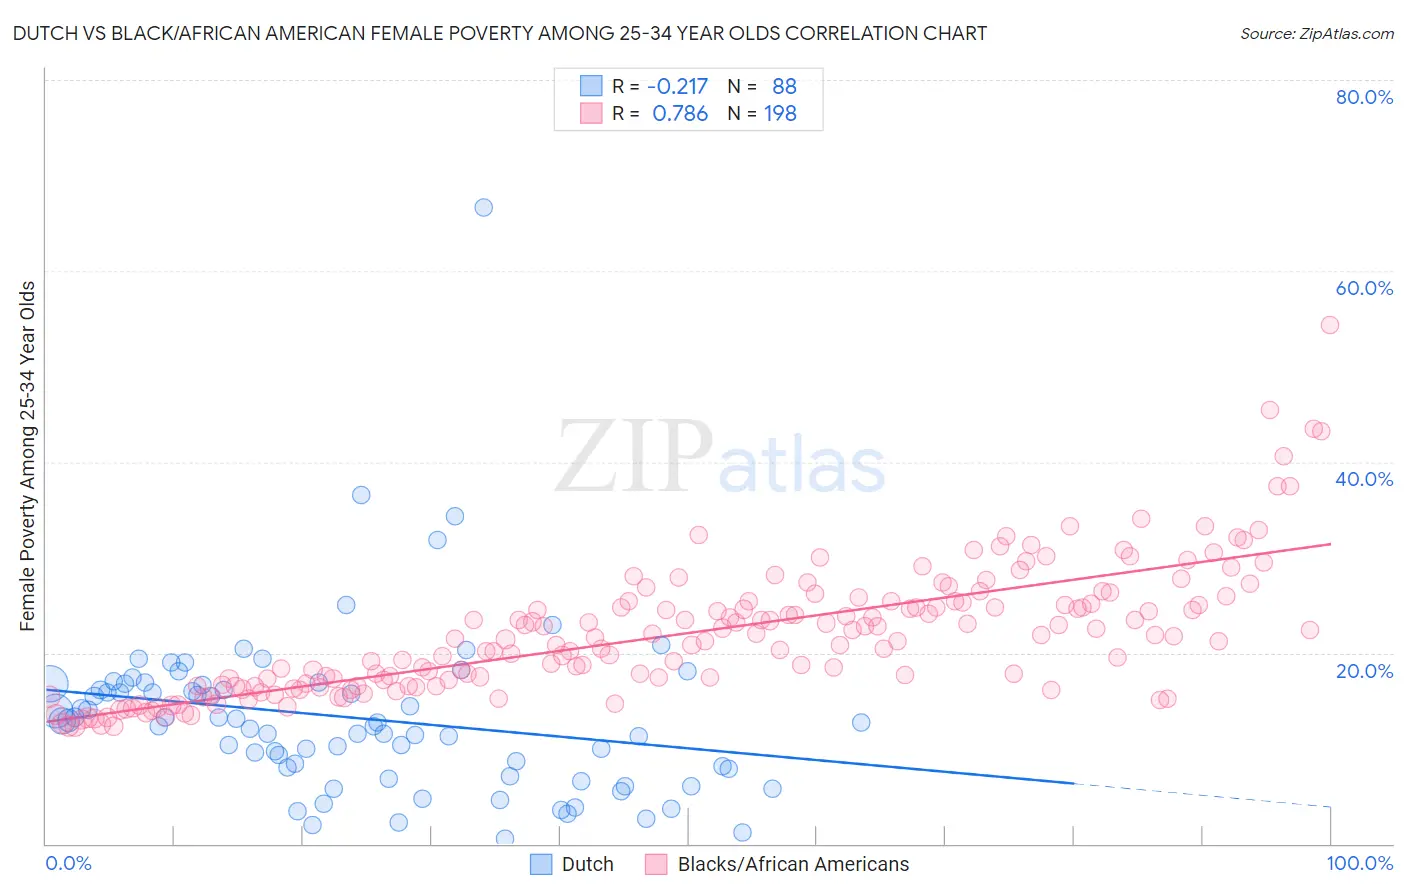
Dutch vs Black/African American Female Poverty Among 25-34 Year Olds Correlation Chart
The statistical analysis conducted on geographies consisting of 534,381,928 people shows a weak negative correlation between the proportion of Dutch and poverty level among females between the ages 25 and 34 in the United States with a correlation coefficient (R) of -0.217 and weighted average of 13.8%. Similarly, the statistical analysis conducted on geographies consisting of 547,087,054 people shows a strong positive correlation between the proportion of Blacks/African Americans and poverty level among females between the ages 25 and 34 in the United States with a correlation coefficient (R) of 0.786 and weighted average of 18.9%, a difference of 37.3%.
Female Poverty Among 25-34 Year Olds Correlation Summary
| Measurement | Dutch | Black/African American |
| Minimum | 0.50% | 12.3% |
| Maximum | 66.7% | 54.3% |
| Range | 66.2% | 42.0% |
| Mean | 13.2% | 22.0% |
| Median | 12.7% | 21.4% |
| Interquartile 25% (IQ1) | 7.9% | 16.5% |
| Interquartile 75% (IQ3) | 16.7% | 25.2% |
| Interquartile Range (IQR) | 8.8% | 8.7% |
| Standard Deviation (Sample) | 8.9% | 6.8% |
| Standard Deviation (Population) | 8.9% | 6.8% |
Similar Demographics by Female Poverty Among 25-34 Year Olds
Demographics Similar to Dutch by Female Poverty Among 25-34 Year Olds
In terms of female poverty among 25-34 year olds, the demographic groups most similar to Dutch are Immigrants from St. Vincent and the Grenadines (13.8%, a difference of 0.040%), Tlingit-Haida (13.8%, a difference of 0.16%), Immigrants from Kenya (13.8%, a difference of 0.17%), Finnish (13.7%, a difference of 0.26%), and Immigrants from Eritrea (13.7%, a difference of 0.28%).
| Demographics | Rating | Rank | Female Poverty Among 25-34 Year Olds |
| Portuguese | 40.3 /100 | #183 | Average 13.6% |
| Czechoslovakians | 36.8 /100 | #184 | Fair 13.7% |
| Irish | 35.3 /100 | #185 | Fair 13.7% |
| Immigrants | Uruguay | 34.1 /100 | #186 | Fair 13.7% |
| Slovaks | 34.1 /100 | #187 | Fair 13.7% |
| Immigrants | Eritrea | 32.7 /100 | #188 | Fair 13.7% |
| Finns | 32.5 /100 | #189 | Fair 13.7% |
| Dutch | 29.7 /100 | #190 | Fair 13.8% |
| Immigrants | St. Vincent and the Grenadines | 29.3 /100 | #191 | Fair 13.8% |
| Tlingit-Haida | 28.1 /100 | #192 | Fair 13.8% |
| Immigrants | Kenya | 28.0 /100 | #193 | Fair 13.8% |
| Moroccans | 25.1 /100 | #194 | Fair 13.8% |
| Immigrants | Cambodia | 24.0 /100 | #195 | Fair 13.9% |
| Scottish | 23.6 /100 | #196 | Fair 13.9% |
| Immigrants | Saudi Arabia | 21.9 /100 | #197 | Fair 13.9% |
Demographics Similar to Blacks/African Americans by Female Poverty Among 25-34 Year Olds
In terms of female poverty among 25-34 year olds, the demographic groups most similar to Blacks/African Americans are Cheyenne (19.1%, a difference of 0.96%), Alaskan Athabascan (19.1%, a difference of 1.0%), Creek (19.2%, a difference of 1.3%), Inupiat (18.5%, a difference of 2.0%), and Dutch West Indian (18.4%, a difference of 2.6%).
| Demographics | Rating | Rank | Female Poverty Among 25-34 Year Olds |
| Menominee | 0.0 /100 | #319 | Tragic 18.0% |
| Chippewa | 0.0 /100 | #320 | Tragic 18.0% |
| Choctaw | 0.0 /100 | #321 | Tragic 18.1% |
| Central American Indians | 0.0 /100 | #322 | Tragic 18.2% |
| Seminole | 0.0 /100 | #323 | Tragic 18.3% |
| Dutch West Indians | 0.0 /100 | #324 | Tragic 18.4% |
| Inupiat | 0.0 /100 | #325 | Tragic 18.5% |
| Blacks/African Americans | 0.0 /100 | #326 | Tragic 18.9% |
| Cheyenne | 0.0 /100 | #327 | Tragic 19.1% |
| Alaskan Athabascans | 0.0 /100 | #328 | Tragic 19.1% |
| Creek | 0.0 /100 | #329 | Tragic 19.2% |
| Paiute | 0.0 /100 | #330 | Tragic 19.6% |
| Kiowa | 0.0 /100 | #331 | Tragic 19.7% |
| Immigrants | Yemen | 0.0 /100 | #332 | Tragic 19.8% |
| Cajuns | 0.0 /100 | #333 | Tragic 19.9% |