Immigrants from Yemen vs White/Caucasian Receiving Food Stamps
COMPARE
Immigrants from Yemen
White/Caucasian
Receiving Food Stamps
Receiving Food Stamps Comparison
Immigrants from Yemen
Whites/Caucasians
21.6%
RECEIVING FOOD STAMPS
0.0/ 100
METRIC RATING
342nd/ 347
METRIC RANK
11.1%
RECEIVING FOOD STAMPS
83.9/ 100
METRIC RATING
147th/ 347
METRIC RANK
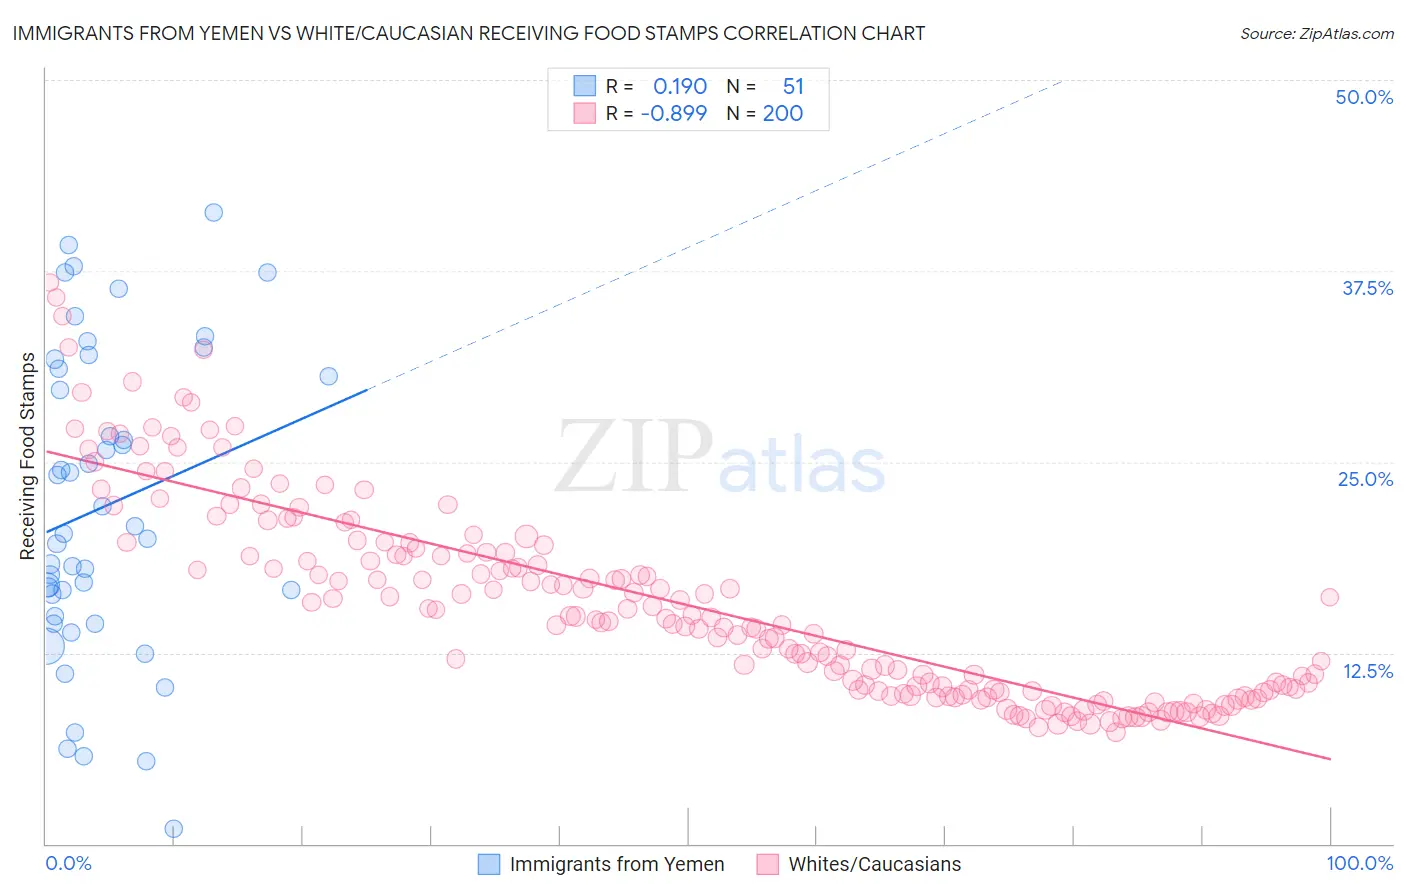
Immigrants from Yemen vs White/Caucasian Receiving Food Stamps Correlation Chart
The statistical analysis conducted on geographies consisting of 82,428,018 people shows a poor positive correlation between the proportion of Immigrants from Yemen and percentage of population receiving government assistance and/or food stamps in the United States with a correlation coefficient (R) of 0.190 and weighted average of 21.6%. Similarly, the statistical analysis conducted on geographies consisting of 580,507,167 people shows a very strong negative correlation between the proportion of Whites/Caucasians and percentage of population receiving government assistance and/or food stamps in the United States with a correlation coefficient (R) of -0.899 and weighted average of 11.1%, a difference of 95.7%.
Receiving Food Stamps Correlation Summary
| Measurement | Immigrants from Yemen | White/Caucasian |
| Minimum | 1.0% | 7.3% |
| Maximum | 41.3% | 36.7% |
| Range | 40.3% | 29.4% |
| Mean | 22.1% | 15.6% |
| Median | 20.3% | 14.5% |
| Interquartile 25% (IQ1) | 14.9% | 10.0% |
| Interquartile 75% (IQ3) | 31.1% | 19.1% |
| Interquartile Range (IQR) | 16.2% | 9.1% |
| Standard Deviation (Sample) | 10.0% | 6.5% |
| Standard Deviation (Population) | 9.9% | 6.5% |
Similar Demographics by Receiving Food Stamps
Demographics Similar to Immigrants from Yemen by Receiving Food Stamps
In terms of receiving food stamps, the demographic groups most similar to Immigrants from Yemen are Hopi (21.6%, a difference of 0.41%), Tohono O'odham (21.5%, a difference of 0.78%), Yakama (21.4%, a difference of 1.0%), Dominican (21.4%, a difference of 1.3%), and Immigrants from Dominican Republic (22.1%, a difference of 2.2%).
| Demographics | Rating | Rank | Receiving Food Stamps |
| Inupiat | 0.0 /100 | #333 | Tragic 20.1% |
| Yuman | 0.0 /100 | #334 | Tragic 20.2% |
| Immigrants | Cuba | 0.0 /100 | #335 | Tragic 20.8% |
| Navajo | 0.0 /100 | #336 | Tragic 21.1% |
| Cape Verdeans | 0.0 /100 | #337 | Tragic 21.1% |
| Dominicans | 0.0 /100 | #338 | Tragic 21.4% |
| Yakama | 0.0 /100 | #339 | Tragic 21.4% |
| Tohono O'odham | 0.0 /100 | #340 | Tragic 21.5% |
| Hopi | 0.0 /100 | #341 | Tragic 21.6% |
| Immigrants | Yemen | 0.0 /100 | #342 | Tragic 21.6% |
| Immigrants | Dominican Republic | 0.0 /100 | #343 | Tragic 22.1% |
| Lumbee | 0.0 /100 | #344 | Tragic 22.9% |
| Immigrants | Cabo Verde | 0.0 /100 | #345 | Tragic 23.8% |
| Puerto Ricans | 0.0 /100 | #346 | Tragic 26.0% |
| Yup'ik | 0.0 /100 | #347 | Tragic 32.7% |
Demographics Similar to Whites/Caucasians by Receiving Food Stamps
In terms of receiving food stamps, the demographic groups most similar to Whites/Caucasians are Taiwanese (11.0%, a difference of 0.090%), Immigrants from South Eastern Asia (11.1%, a difference of 0.16%), Brazilian (11.1%, a difference of 0.18%), Soviet Union (11.1%, a difference of 0.21%), and Hungarian (11.0%, a difference of 0.34%).
| Demographics | Rating | Rank | Receiving Food Stamps |
| Celtics | 87.8 /100 | #140 | Excellent 10.9% |
| Immigrants | Vietnam | 86.7 /100 | #141 | Excellent 11.0% |
| Chileans | 86.2 /100 | #142 | Excellent 11.0% |
| Immigrants | Northern Africa | 86.0 /100 | #143 | Excellent 11.0% |
| Syrians | 85.5 /100 | #144 | Excellent 11.0% |
| Hungarians | 85.1 /100 | #145 | Excellent 11.0% |
| Taiwanese | 84.2 /100 | #146 | Excellent 11.0% |
| Whites/Caucasians | 83.9 /100 | #147 | Excellent 11.1% |
| Immigrants | South Eastern Asia | 83.3 /100 | #148 | Excellent 11.1% |
| Brazilians | 83.2 /100 | #149 | Excellent 11.1% |
| Soviet Union | 83.1 /100 | #150 | Excellent 11.1% |
| Immigrants | Spain | 81.7 /100 | #151 | Excellent 11.1% |
| Immigrants | Kazakhstan | 81.7 /100 | #152 | Excellent 11.1% |
| Lebanese | 81.6 /100 | #153 | Excellent 11.1% |
| Armenians | 81.4 /100 | #154 | Excellent 11.1% |