Dominican vs Immigrants from Kazakhstan Family Poverty
COMPARE
Dominican
Immigrants from Kazakhstan
Family Poverty
Family Poverty Comparison
Dominicans
Immigrants from Kazakhstan
14.3%
FAMILY POVERTY
0.0/ 100
METRIC RATING
332nd/ 347
METRIC RANK
8.5%
FAMILY POVERTY
84.1/ 100
METRIC RATING
140th/ 347
METRIC RANK
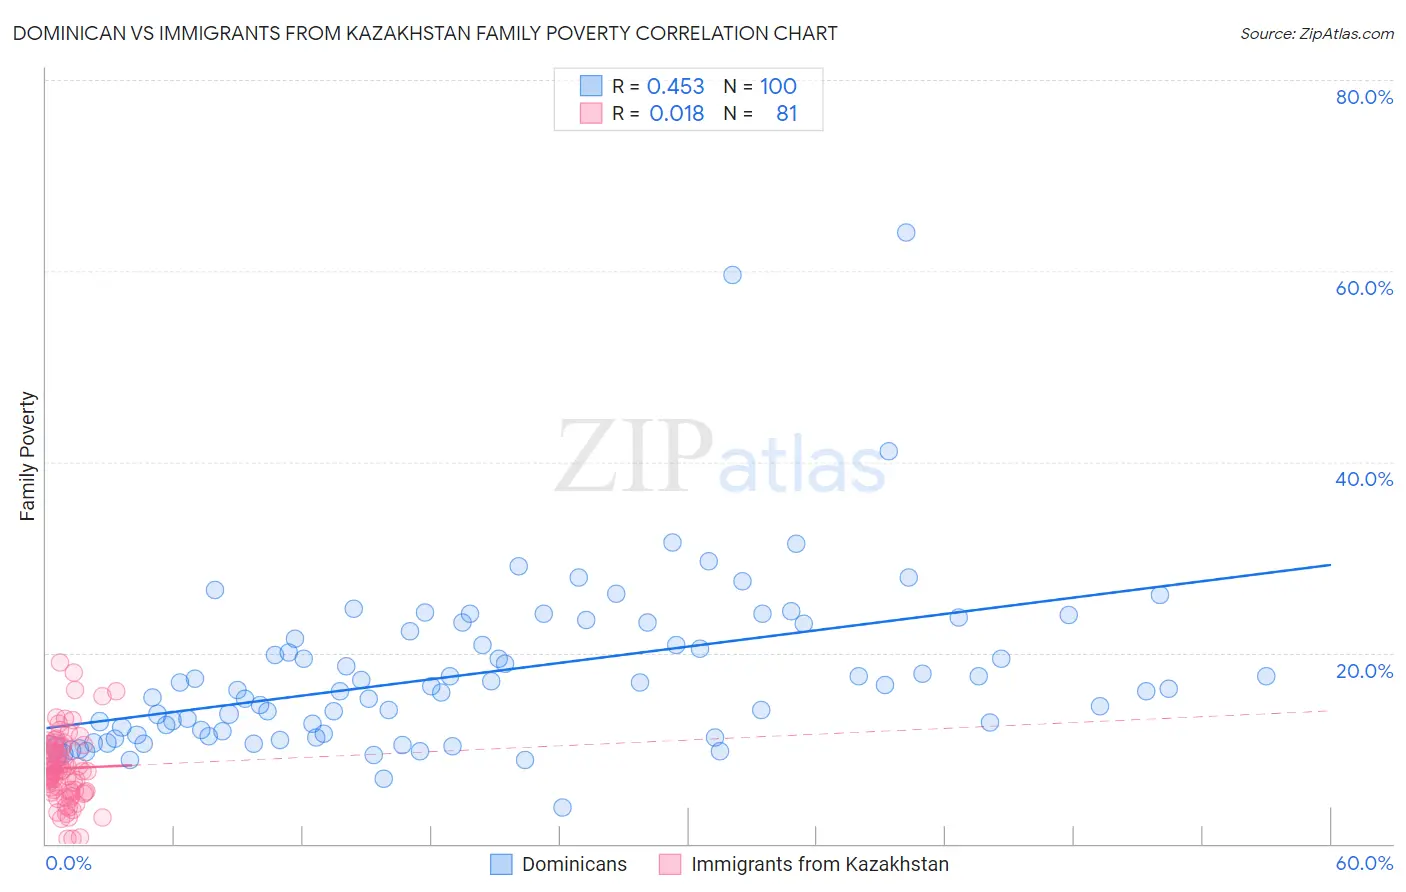
Dominican vs Immigrants from Kazakhstan Family Poverty Correlation Chart
The statistical analysis conducted on geographies consisting of 353,965,759 people shows a moderate positive correlation between the proportion of Dominicans and poverty level among families in the United States with a correlation coefficient (R) of 0.453 and weighted average of 14.3%. Similarly, the statistical analysis conducted on geographies consisting of 124,352,430 people shows no correlation between the proportion of Immigrants from Kazakhstan and poverty level among families in the United States with a correlation coefficient (R) of 0.018 and weighted average of 8.5%, a difference of 68.4%.
Family Poverty Correlation Summary
| Measurement | Dominican | Immigrants from Kazakhstan |
| Minimum | 3.8% | 0.57% |
| Maximum | 64.0% | 19.0% |
| Range | 60.2% | 18.4% |
| Mean | 17.9% | 7.9% |
| Median | 16.1% | 7.6% |
| Interquartile 25% (IQ1) | 11.4% | 5.5% |
| Interquartile 75% (IQ3) | 22.6% | 10.1% |
| Interquartile Range (IQR) | 11.2% | 4.6% |
| Standard Deviation (Sample) | 9.1% | 3.7% |
| Standard Deviation (Population) | 9.1% | 3.7% |
Similar Demographics by Family Poverty
Demographics Similar to Dominicans by Family Poverty
In terms of family poverty, the demographic groups most similar to Dominicans are Cheyenne (14.3%, a difference of 0.44%), Native/Alaskan (14.3%, a difference of 0.58%), Immigrants from Dominican Republic (14.4%, a difference of 0.63%), Houma (14.6%, a difference of 1.9%), and Apache (14.7%, a difference of 2.8%).
| Demographics | Rating | Rank | Family Poverty |
| Paiute | 0.0 /100 | #325 | Tragic 13.0% |
| Colville | 0.0 /100 | #326 | Tragic 13.0% |
| Yakama | 0.0 /100 | #327 | Tragic 13.1% |
| Central American Indians | 0.0 /100 | #328 | Tragic 13.3% |
| Blacks/African Americans | 0.0 /100 | #329 | Tragic 13.3% |
| Natives/Alaskans | 0.0 /100 | #330 | Tragic 14.3% |
| Cheyenne | 0.0 /100 | #331 | Tragic 14.3% |
| Dominicans | 0.0 /100 | #332 | Tragic 14.3% |
| Immigrants | Dominican Republic | 0.0 /100 | #333 | Tragic 14.4% |
| Houma | 0.0 /100 | #334 | Tragic 14.6% |
| Apache | 0.0 /100 | #335 | Tragic 14.7% |
| Sioux | 0.0 /100 | #336 | Tragic 15.9% |
| Hopi | 0.0 /100 | #337 | Tragic 15.9% |
| Crow | 0.0 /100 | #338 | Tragic 16.1% |
| Yuman | 0.0 /100 | #339 | Tragic 16.6% |
Demographics Similar to Immigrants from Kazakhstan by Family Poverty
In terms of family poverty, the demographic groups most similar to Immigrants from Kazakhstan are Immigrants from Nepal (8.5%, a difference of 0.030%), Immigrants from Ukraine (8.5%, a difference of 0.030%), Armenian (8.5%, a difference of 0.15%), Yugoslavian (8.5%, a difference of 0.15%), and Immigrants from Germany (8.5%, a difference of 0.18%).
| Demographics | Rating | Rank | Family Poverty |
| Sri Lankans | 86.6 /100 | #133 | Excellent 8.5% |
| Chileans | 86.6 /100 | #134 | Excellent 8.5% |
| Immigrants | Malaysia | 86.5 /100 | #135 | Excellent 8.5% |
| Immigrants | Brazil | 86.3 /100 | #136 | Excellent 8.5% |
| Immigrants | Southern Europe | 86.0 /100 | #137 | Excellent 8.5% |
| Armenians | 84.6 /100 | #138 | Excellent 8.5% |
| Immigrants | Nepal | 84.2 /100 | #139 | Excellent 8.5% |
| Immigrants | Kazakhstan | 84.1 /100 | #140 | Excellent 8.5% |
| Immigrants | Ukraine | 83.9 /100 | #141 | Excellent 8.5% |
| Yugoslavians | 83.5 /100 | #142 | Excellent 8.5% |
| Immigrants | Germany | 83.3 /100 | #143 | Excellent 8.5% |
| Albanians | 83.3 /100 | #144 | Excellent 8.5% |
| Immigrants | South Eastern Asia | 83.2 /100 | #145 | Excellent 8.5% |
| Immigrants | Belarus | 83.2 /100 | #146 | Excellent 8.5% |
| Immigrants | Jordan | 83.0 /100 | #147 | Excellent 8.5% |