Chinese vs South American Receiving Food Stamps
COMPARE
Chinese
South American
Receiving Food Stamps
Receiving Food Stamps Comparison
Chinese
South Americans
9.8%
RECEIVING FOOD STAMPS
99.2/ 100
METRIC RATING
63rd/ 347
METRIC RANK
12.4%
RECEIVING FOOD STAMPS
16.0/ 100
METRIC RATING
207th/ 347
METRIC RANK
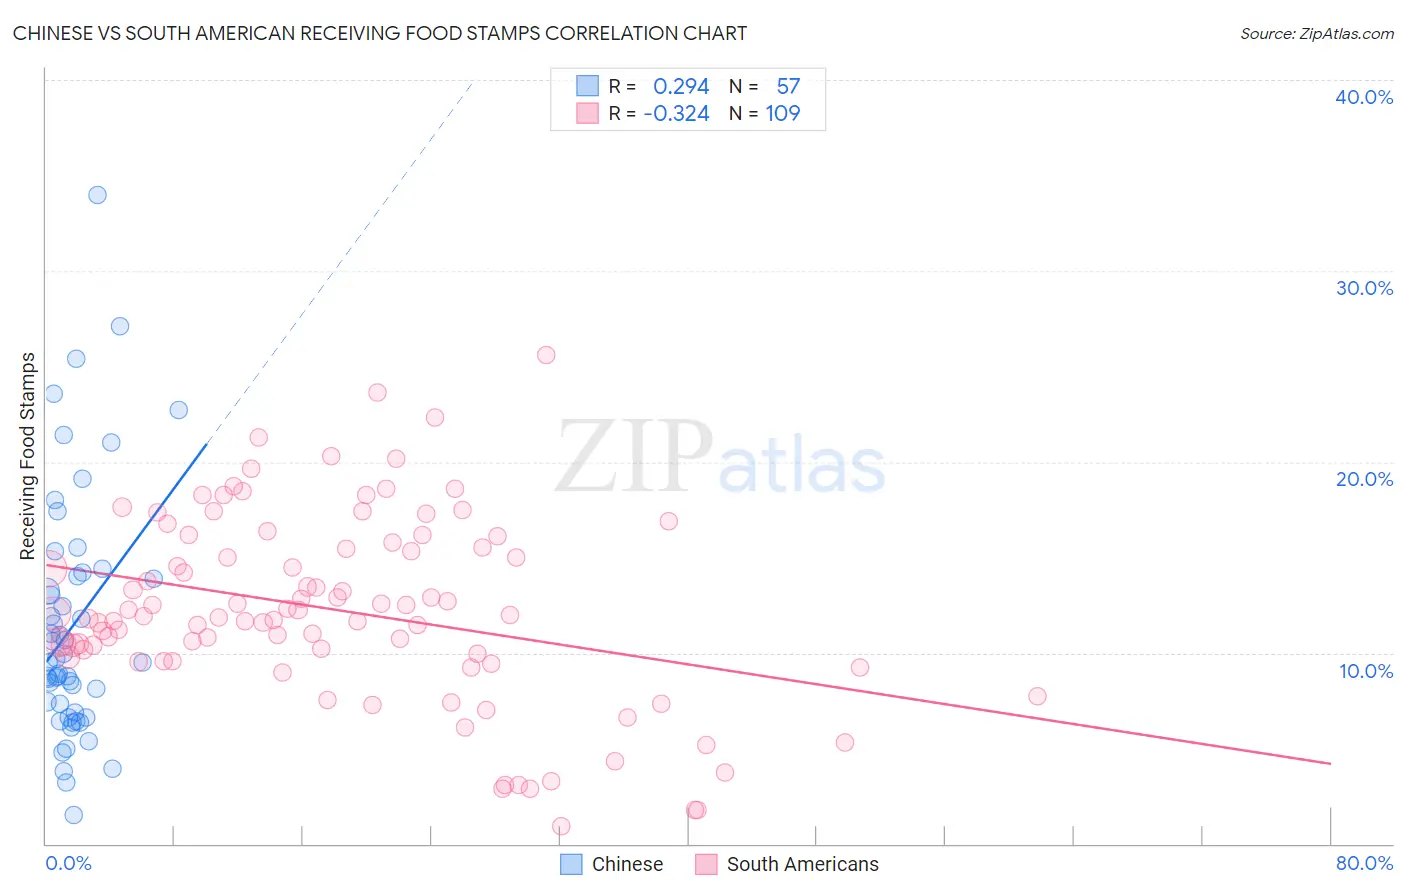
Chinese vs South American Receiving Food Stamps Correlation Chart
The statistical analysis conducted on geographies consisting of 64,766,872 people shows a weak positive correlation between the proportion of Chinese and percentage of population receiving government assistance and/or food stamps in the United States with a correlation coefficient (R) of 0.294 and weighted average of 9.8%. Similarly, the statistical analysis conducted on geographies consisting of 491,814,121 people shows a mild negative correlation between the proportion of South Americans and percentage of population receiving government assistance and/or food stamps in the United States with a correlation coefficient (R) of -0.324 and weighted average of 12.4%, a difference of 27.2%.
Receiving Food Stamps Correlation Summary
| Measurement | Chinese | South American |
| Minimum | 1.5% | 0.90% |
| Maximum | 34.0% | 25.6% |
| Range | 32.5% | 24.7% |
| Mean | 11.5% | 12.2% |
| Median | 9.5% | 11.9% |
| Interquartile 25% (IQ1) | 6.8% | 9.7% |
| Interquartile 75% (IQ3) | 14.1% | 15.6% |
| Interquartile Range (IQR) | 7.3% | 6.0% |
| Standard Deviation (Sample) | 6.5% | 4.9% |
| Standard Deviation (Population) | 6.4% | 4.9% |
Similar Demographics by Receiving Food Stamps
Demographics Similar to Chinese by Receiving Food Stamps
In terms of receiving food stamps, the demographic groups most similar to Chinese are Immigrants from Bulgaria (9.8%, a difference of 0.030%), Immigrants from North America (9.8%, a difference of 0.090%), English (9.8%, a difference of 0.11%), German (9.7%, a difference of 0.25%), and Immigrants from Turkey (9.8%, a difference of 0.26%).
| Demographics | Rating | Rank | Receiving Food Stamps |
| Immigrants | Canada | 99.3 /100 | #56 | Exceptional 9.7% |
| Greeks | 99.3 /100 | #57 | Exceptional 9.7% |
| Scandinavians | 99.2 /100 | #58 | Exceptional 9.7% |
| British | 99.2 /100 | #59 | Exceptional 9.7% |
| Germans | 99.2 /100 | #60 | Exceptional 9.7% |
| English | 99.2 /100 | #61 | Exceptional 9.8% |
| Immigrants | Bulgaria | 99.2 /100 | #62 | Exceptional 9.8% |
| Chinese | 99.2 /100 | #63 | Exceptional 9.8% |
| Immigrants | North America | 99.2 /100 | #64 | Exceptional 9.8% |
| Immigrants | Turkey | 99.1 /100 | #65 | Exceptional 9.8% |
| Slovenes | 99.1 /100 | #66 | Exceptional 9.8% |
| Immigrants | Indonesia | 99.0 /100 | #67 | Exceptional 9.8% |
| Northern Europeans | 99.0 /100 | #68 | Exceptional 9.8% |
| Italians | 99.0 /100 | #69 | Exceptional 9.9% |
| Immigrants | Serbia | 99.0 /100 | #70 | Exceptional 9.9% |
Demographics Similar to South Americans by Receiving Food Stamps
In terms of receiving food stamps, the demographic groups most similar to South Americans are Immigrants from Thailand (12.4%, a difference of 0.26%), Aleut (12.4%, a difference of 0.33%), Potawatomi (12.5%, a difference of 0.36%), Nonimmigrants (12.4%, a difference of 0.39%), and Shoshone (12.4%, a difference of 0.42%).
| Demographics | Rating | Rank | Receiving Food Stamps |
| Sierra Leoneans | 23.6 /100 | #200 | Fair 12.2% |
| Ugandans | 22.5 /100 | #201 | Fair 12.2% |
| Immigrants | Venezuela | 20.1 /100 | #202 | Fair 12.3% |
| Shoshone | 17.7 /100 | #203 | Poor 12.4% |
| Immigrants | Nonimmigrants | 17.6 /100 | #204 | Poor 12.4% |
| Aleuts | 17.3 /100 | #205 | Poor 12.4% |
| Immigrants | Thailand | 17.0 /100 | #206 | Poor 12.4% |
| South Americans | 16.0 /100 | #207 | Poor 12.4% |
| Potawatomi | 14.6 /100 | #208 | Poor 12.5% |
| Immigrants | Sierra Leone | 12.9 /100 | #209 | Poor 12.5% |
| Immigrants | Uruguay | 12.8 /100 | #210 | Poor 12.5% |
| Colombians | 10.2 /100 | #211 | Poor 12.6% |
| Malaysians | 8.5 /100 | #212 | Tragic 12.7% |
| Moroccans | 7.6 /100 | #213 | Tragic 12.8% |
| Immigrants | Africa | 7.6 /100 | #214 | Tragic 12.8% |