Immigrants from India vs South American Receiving Food Stamps
COMPARE
Immigrants from India
South American
Receiving Food Stamps
Receiving Food Stamps Comparison
Immigrants from India
South Americans
7.4%
RECEIVING FOOD STAMPS
100.0/ 100
METRIC RATING
2nd/ 347
METRIC RANK
12.4%
RECEIVING FOOD STAMPS
16.0/ 100
METRIC RATING
207th/ 347
METRIC RANK
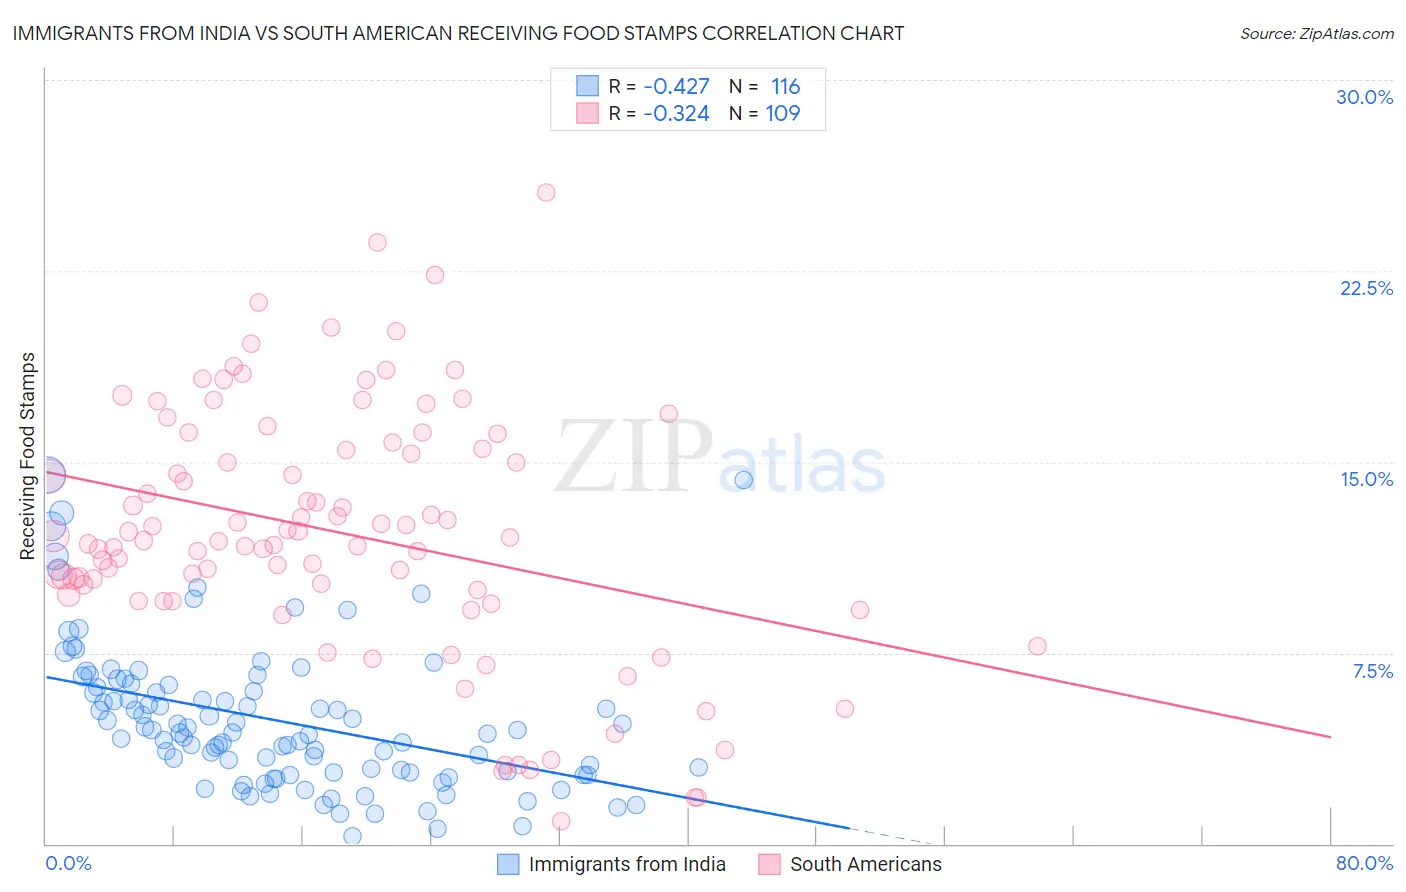
Immigrants from India vs South American Receiving Food Stamps Correlation Chart
The statistical analysis conducted on geographies consisting of 432,357,413 people shows a moderate negative correlation between the proportion of Immigrants from India and percentage of population receiving government assistance and/or food stamps in the United States with a correlation coefficient (R) of -0.427 and weighted average of 7.4%. Similarly, the statistical analysis conducted on geographies consisting of 491,814,121 people shows a mild negative correlation between the proportion of South Americans and percentage of population receiving government assistance and/or food stamps in the United States with a correlation coefficient (R) of -0.324 and weighted average of 12.4%, a difference of 68.4%.
Receiving Food Stamps Correlation Summary
| Measurement | Immigrants from India | South American |
| Minimum | 0.30% | 0.90% |
| Maximum | 14.5% | 25.6% |
| Range | 14.2% | 24.7% |
| Mean | 4.8% | 12.2% |
| Median | 4.4% | 11.9% |
| Interquartile 25% (IQ1) | 2.8% | 9.7% |
| Interquartile 75% (IQ3) | 6.2% | 15.6% |
| Interquartile Range (IQR) | 3.4% | 6.0% |
| Standard Deviation (Sample) | 2.8% | 4.9% |
| Standard Deviation (Population) | 2.8% | 4.9% |
Similar Demographics by Receiving Food Stamps
Demographics Similar to Immigrants from India by Receiving Food Stamps
In terms of receiving food stamps, the demographic groups most similar to Immigrants from India are Filipino (7.4%, a difference of 0.28%), Immigrants from Taiwan (7.3%, a difference of 0.87%), Iranian (7.9%, a difference of 7.6%), Thai (8.1%, a difference of 10.0%), and Immigrants from Singapore (8.3%, a difference of 12.6%).
| Demographics | Rating | Rank | Receiving Food Stamps |
| Immigrants | Taiwan | 100.0 /100 | #1 | Exceptional 7.3% |
| Immigrants | India | 100.0 /100 | #2 | Exceptional 7.4% |
| Filipinos | 100.0 /100 | #3 | Exceptional 7.4% |
| Iranians | 100.0 /100 | #4 | Exceptional 7.9% |
| Thais | 100.0 /100 | #5 | Exceptional 8.1% |
| Immigrants | Singapore | 100.0 /100 | #6 | Exceptional 8.3% |
| Immigrants | Iran | 100.0 /100 | #7 | Exceptional 8.3% |
| Burmese | 99.9 /100 | #8 | Exceptional 8.6% |
| Immigrants | Korea | 99.9 /100 | #9 | Exceptional 8.7% |
| Immigrants | South Central Asia | 99.9 /100 | #10 | Exceptional 8.8% |
| Okinawans | 99.9 /100 | #11 | Exceptional 8.9% |
| Cypriots | 99.9 /100 | #12 | Exceptional 8.9% |
| Bulgarians | 99.9 /100 | #13 | Exceptional 8.9% |
| Maltese | 99.9 /100 | #14 | Exceptional 8.9% |
| Norwegians | 99.9 /100 | #15 | Exceptional 9.0% |
Demographics Similar to South Americans by Receiving Food Stamps
In terms of receiving food stamps, the demographic groups most similar to South Americans are Immigrants from Thailand (12.4%, a difference of 0.26%), Aleut (12.4%, a difference of 0.33%), Potawatomi (12.5%, a difference of 0.36%), Nonimmigrants (12.4%, a difference of 0.39%), and Shoshone (12.4%, a difference of 0.42%).
| Demographics | Rating | Rank | Receiving Food Stamps |
| Sierra Leoneans | 23.6 /100 | #200 | Fair 12.2% |
| Ugandans | 22.5 /100 | #201 | Fair 12.2% |
| Immigrants | Venezuela | 20.1 /100 | #202 | Fair 12.3% |
| Shoshone | 17.7 /100 | #203 | Poor 12.4% |
| Immigrants | Nonimmigrants | 17.6 /100 | #204 | Poor 12.4% |
| Aleuts | 17.3 /100 | #205 | Poor 12.4% |
| Immigrants | Thailand | 17.0 /100 | #206 | Poor 12.4% |
| South Americans | 16.0 /100 | #207 | Poor 12.4% |
| Potawatomi | 14.6 /100 | #208 | Poor 12.5% |
| Immigrants | Sierra Leone | 12.9 /100 | #209 | Poor 12.5% |
| Immigrants | Uruguay | 12.8 /100 | #210 | Poor 12.5% |
| Colombians | 10.2 /100 | #211 | Poor 12.6% |
| Malaysians | 8.5 /100 | #212 | Tragic 12.7% |
| Moroccans | 7.6 /100 | #213 | Tragic 12.8% |
| Immigrants | Africa | 7.6 /100 | #214 | Tragic 12.8% |