Delaware vs Navajo Single Mother Poverty
COMPARE
Delaware
Navajo
Single Mother Poverty
Single Mother Poverty Comparison
Delaware
Navajo
31.8%
SINGLE MOTHER POVERTY
0.0/ 100
METRIC RATING
276th/ 347
METRIC RANK
40.2%
SINGLE MOTHER POVERTY
0.0/ 100
METRIC RATING
342nd/ 347
METRIC RANK
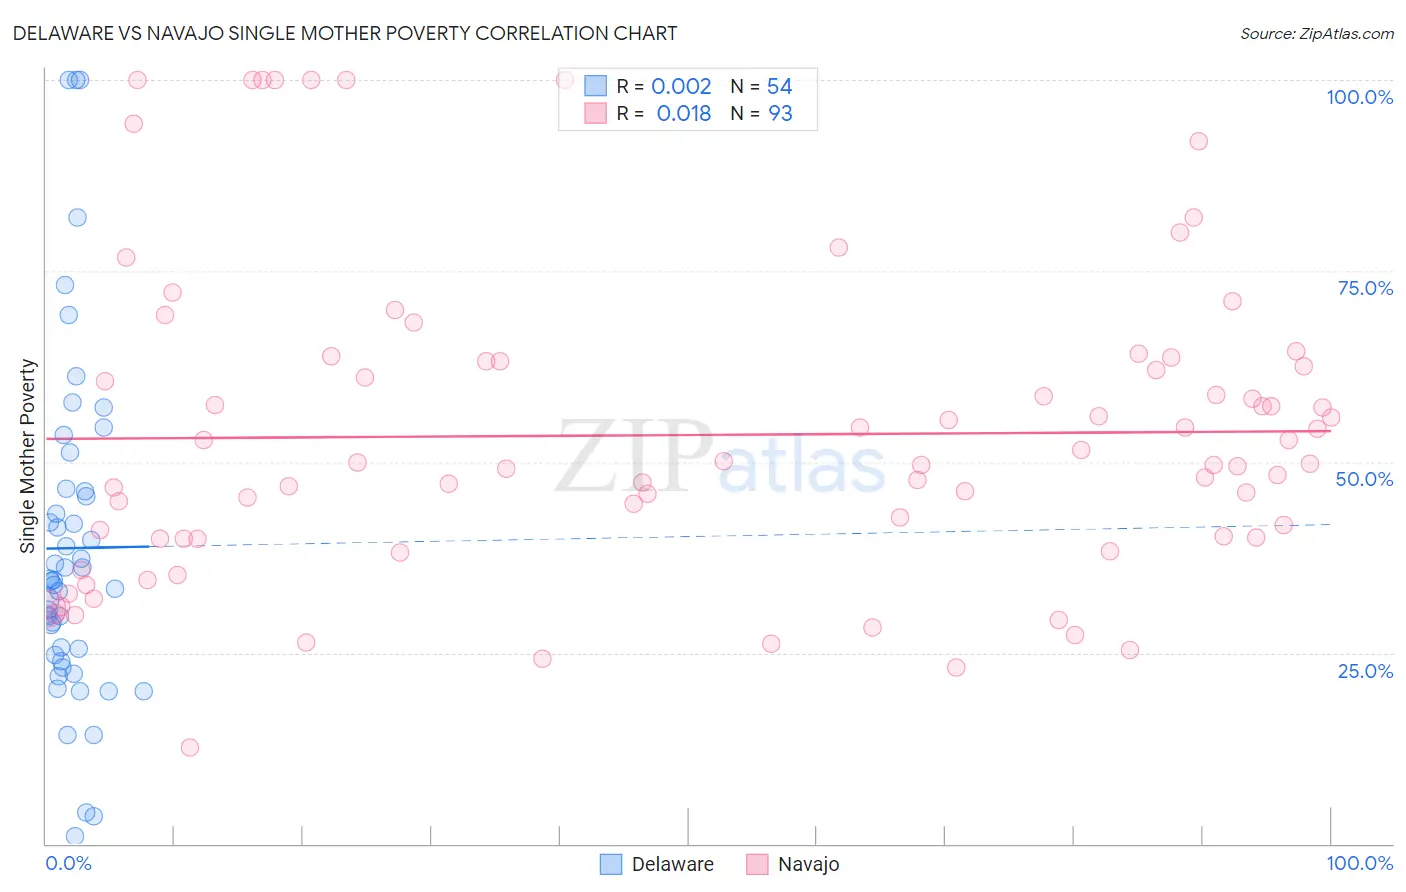
Delaware vs Navajo Single Mother Poverty Correlation Chart
The statistical analysis conducted on geographies consisting of 95,376,359 people shows no correlation between the proportion of Delaware and poverty level among single mothers in the United States with a correlation coefficient (R) of 0.002 and weighted average of 31.8%. Similarly, the statistical analysis conducted on geographies consisting of 222,508,817 people shows no correlation between the proportion of Navajo and poverty level among single mothers in the United States with a correlation coefficient (R) of 0.018 and weighted average of 40.2%, a difference of 26.3%.
Single Mother Poverty Correlation Summary
| Measurement | Delaware | Navajo |
| Minimum | 1.1% | 12.6% |
| Maximum | 100.0% | 100.0% |
| Range | 98.9% | 87.4% |
| Mean | 38.7% | 53.5% |
| Median | 34.5% | 49.8% |
| Interquartile 25% (IQ1) | 24.8% | 40.0% |
| Interquartile 75% (IQ3) | 46.2% | 63.1% |
| Interquartile Range (IQR) | 21.4% | 23.1% |
| Standard Deviation (Sample) | 22.2% | 20.3% |
| Standard Deviation (Population) | 21.9% | 20.2% |
Similar Demographics by Single Mother Poverty
Demographics Similar to Delaware by Single Mother Poverty
In terms of single mother poverty, the demographic groups most similar to Delaware are Central American (31.8%, a difference of 0.16%), Mexican American Indian (31.9%, a difference of 0.21%), Bangladeshi (31.7%, a difference of 0.35%), Immigrants from Zaire (32.0%, a difference of 0.43%), and Fijian (31.6%, a difference of 0.58%).
| Demographics | Rating | Rank | Single Mother Poverty |
| Scotch-Irish | 0.1 /100 | #269 | Tragic 31.5% |
| British West Indians | 0.1 /100 | #270 | Tragic 31.5% |
| Immigrants | Cabo Verde | 0.1 /100 | #271 | Tragic 31.6% |
| Immigrants | Micronesia | 0.1 /100 | #272 | Tragic 31.6% |
| Fijians | 0.1 /100 | #273 | Tragic 31.6% |
| Bangladeshis | 0.1 /100 | #274 | Tragic 31.7% |
| Central Americans | 0.1 /100 | #275 | Tragic 31.8% |
| Delaware | 0.0 /100 | #276 | Tragic 31.8% |
| Mexican American Indians | 0.0 /100 | #277 | Tragic 31.9% |
| Immigrants | Zaire | 0.0 /100 | #278 | Tragic 32.0% |
| Marshallese | 0.0 /100 | #279 | Tragic 32.1% |
| Immigrants | Nonimmigrants | 0.0 /100 | #280 | Tragic 32.2% |
| Cree | 0.0 /100 | #281 | Tragic 32.2% |
| Immigrants | Azores | 0.0 /100 | #282 | Tragic 32.2% |
| Spanish Americans | 0.0 /100 | #283 | Tragic 32.3% |
Demographics Similar to Navajo by Single Mother Poverty
In terms of single mother poverty, the demographic groups most similar to Navajo are Cajun (40.3%, a difference of 0.33%), Colville (39.3%, a difference of 2.4%), Sioux (38.8%, a difference of 3.7%), Crow (38.6%, a difference of 4.1%), and Pima (38.6%, a difference of 4.2%).
| Demographics | Rating | Rank | Single Mother Poverty |
| Menominee | 0.0 /100 | #333 | Tragic 37.1% |
| Pueblo | 0.0 /100 | #334 | Tragic 37.2% |
| Yuman | 0.0 /100 | #335 | Tragic 37.8% |
| Cheyenne | 0.0 /100 | #336 | Tragic 38.5% |
| Immigrants | Yemen | 0.0 /100 | #337 | Tragic 38.5% |
| Pima | 0.0 /100 | #338 | Tragic 38.6% |
| Crow | 0.0 /100 | #339 | Tragic 38.6% |
| Sioux | 0.0 /100 | #340 | Tragic 38.8% |
| Colville | 0.0 /100 | #341 | Tragic 39.3% |
| Navajo | 0.0 /100 | #342 | Tragic 40.2% |
| Cajuns | 0.0 /100 | #343 | Tragic 40.3% |
| Tohono O'odham | 0.0 /100 | #344 | Tragic 43.0% |
| Lumbee | 0.0 /100 | #345 | Tragic 43.2% |
| Houma | 0.0 /100 | #346 | Tragic 43.5% |
| Puerto Ricans | 0.0 /100 | #347 | Tragic 44.5% |