Dutch vs Navajo Single Mother Poverty
COMPARE
Dutch
Navajo
Single Mother Poverty
Single Mother Poverty Comparison
Dutch
Navajo
30.2%
SINGLE MOTHER POVERTY
4.3/ 100
METRIC RATING
231st/ 347
METRIC RANK
40.2%
SINGLE MOTHER POVERTY
0.0/ 100
METRIC RATING
342nd/ 347
METRIC RANK
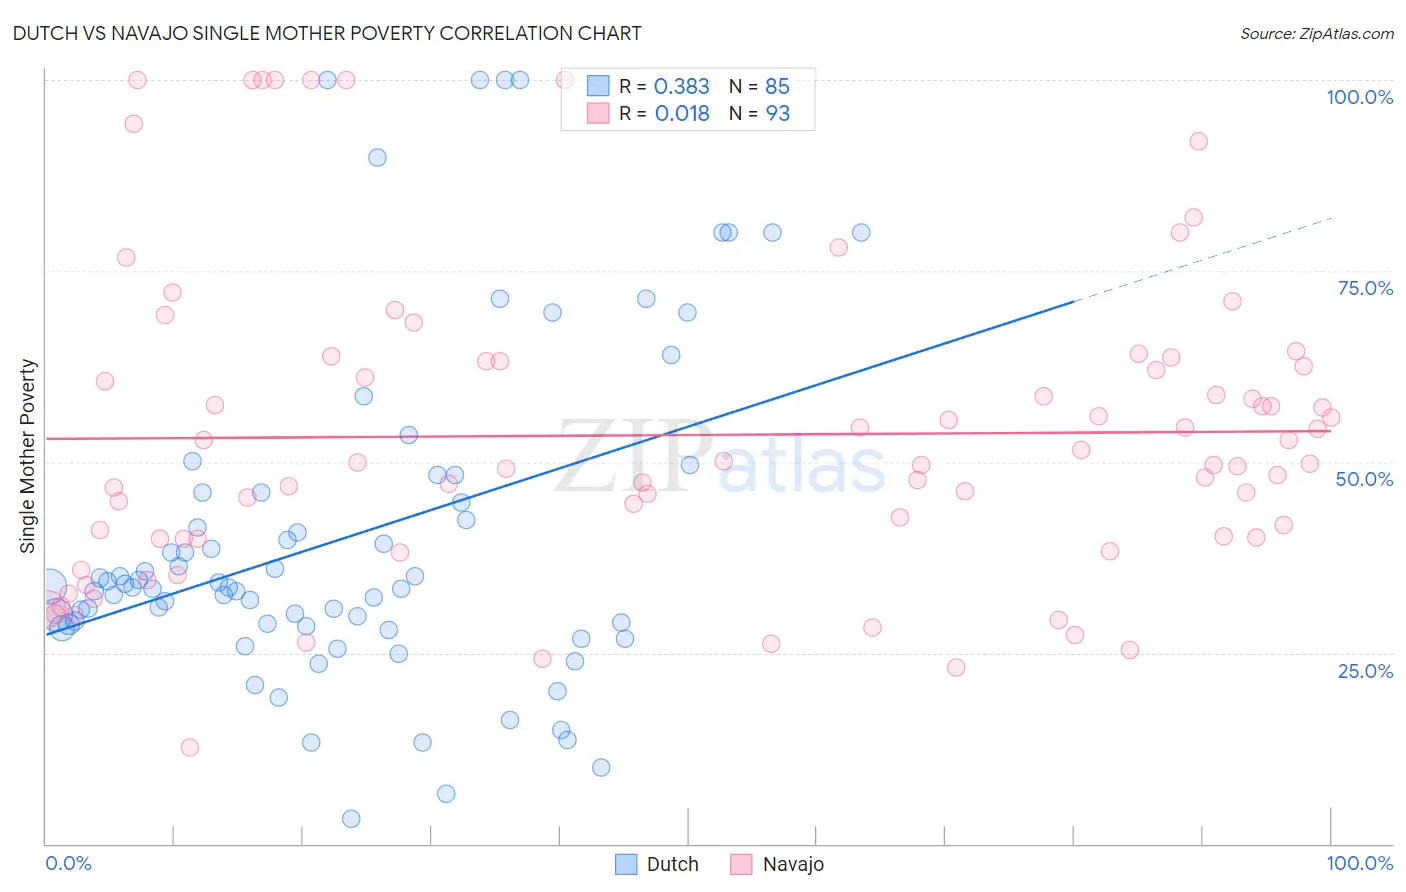
Dutch vs Navajo Single Mother Poverty Correlation Chart
The statistical analysis conducted on geographies consisting of 528,669,117 people shows a mild positive correlation between the proportion of Dutch and poverty level among single mothers in the United States with a correlation coefficient (R) of 0.383 and weighted average of 30.2%. Similarly, the statistical analysis conducted on geographies consisting of 222,508,817 people shows no correlation between the proportion of Navajo and poverty level among single mothers in the United States with a correlation coefficient (R) of 0.018 and weighted average of 40.2%, a difference of 32.9%.
Single Mother Poverty Correlation Summary
| Measurement | Dutch | Navajo |
| Minimum | 3.2% | 12.6% |
| Maximum | 100.0% | 100.0% |
| Range | 96.8% | 87.4% |
| Mean | 40.1% | 53.5% |
| Median | 33.5% | 49.8% |
| Interquartile 25% (IQ1) | 28.6% | 40.0% |
| Interquartile 75% (IQ3) | 46.0% | 63.1% |
| Interquartile Range (IQR) | 17.4% | 23.1% |
| Standard Deviation (Sample) | 21.9% | 20.3% |
| Standard Deviation (Population) | 21.8% | 20.2% |
Similar Demographics by Single Mother Poverty
Demographics Similar to Dutch by Single Mother Poverty
In terms of single mother poverty, the demographic groups most similar to Dutch are Alaskan Athabascan (30.3%, a difference of 0.040%), English (30.2%, a difference of 0.15%), Immigrants from Barbados (30.2%, a difference of 0.19%), Immigrants from Middle Africa (30.3%, a difference of 0.25%), and Immigrants from Nicaragua (30.3%, a difference of 0.25%).
| Demographics | Rating | Rank | Single Mother Poverty |
| Immigrants | Sudan | 6.5 /100 | #224 | Tragic 30.1% |
| Spanish | 6.3 /100 | #225 | Tragic 30.1% |
| Scottish | 6.0 /100 | #226 | Tragic 30.1% |
| Immigrants | Liberia | 5.9 /100 | #227 | Tragic 30.1% |
| Spaniards | 5.4 /100 | #228 | Tragic 30.2% |
| Immigrants | Barbados | 5.0 /100 | #229 | Tragic 30.2% |
| English | 4.8 /100 | #230 | Tragic 30.2% |
| Dutch | 4.3 /100 | #231 | Tragic 30.2% |
| Alaskan Athabascans | 4.1 /100 | #232 | Tragic 30.3% |
| Immigrants | Middle Africa | 3.5 /100 | #233 | Tragic 30.3% |
| Immigrants | Nicaragua | 3.5 /100 | #234 | Tragic 30.3% |
| Immigrants | Grenada | 3.4 /100 | #235 | Tragic 30.3% |
| Welsh | 3.2 /100 | #236 | Tragic 30.4% |
| Immigrants | St. Vincent and the Grenadines | 3.1 /100 | #237 | Tragic 30.4% |
| Slovaks | 2.8 /100 | #238 | Tragic 30.4% |
Demographics Similar to Navajo by Single Mother Poverty
In terms of single mother poverty, the demographic groups most similar to Navajo are Cajun (40.3%, a difference of 0.33%), Colville (39.3%, a difference of 2.4%), Sioux (38.8%, a difference of 3.7%), Crow (38.6%, a difference of 4.1%), and Pima (38.6%, a difference of 4.2%).
| Demographics | Rating | Rank | Single Mother Poverty |
| Menominee | 0.0 /100 | #333 | Tragic 37.1% |
| Pueblo | 0.0 /100 | #334 | Tragic 37.2% |
| Yuman | 0.0 /100 | #335 | Tragic 37.8% |
| Cheyenne | 0.0 /100 | #336 | Tragic 38.5% |
| Immigrants | Yemen | 0.0 /100 | #337 | Tragic 38.5% |
| Pima | 0.0 /100 | #338 | Tragic 38.6% |
| Crow | 0.0 /100 | #339 | Tragic 38.6% |
| Sioux | 0.0 /100 | #340 | Tragic 38.8% |
| Colville | 0.0 /100 | #341 | Tragic 39.3% |
| Navajo | 0.0 /100 | #342 | Tragic 40.2% |
| Cajuns | 0.0 /100 | #343 | Tragic 40.3% |
| Tohono O'odham | 0.0 /100 | #344 | Tragic 43.0% |
| Lumbee | 0.0 /100 | #345 | Tragic 43.2% |
| Houma | 0.0 /100 | #346 | Tragic 43.5% |
| Puerto Ricans | 0.0 /100 | #347 | Tragic 44.5% |