Delaware vs Immigrants from Serbia Single Mother Poverty
COMPARE
Delaware
Immigrants from Serbia
Single Mother Poverty
Single Mother Poverty Comparison
Delaware
Immigrants from Serbia
31.8%
SINGLE MOTHER POVERTY
0.0/ 100
METRIC RATING
276th/ 347
METRIC RANK
26.9%
SINGLE MOTHER POVERTY
99.9/ 100
METRIC RATING
46th/ 347
METRIC RANK
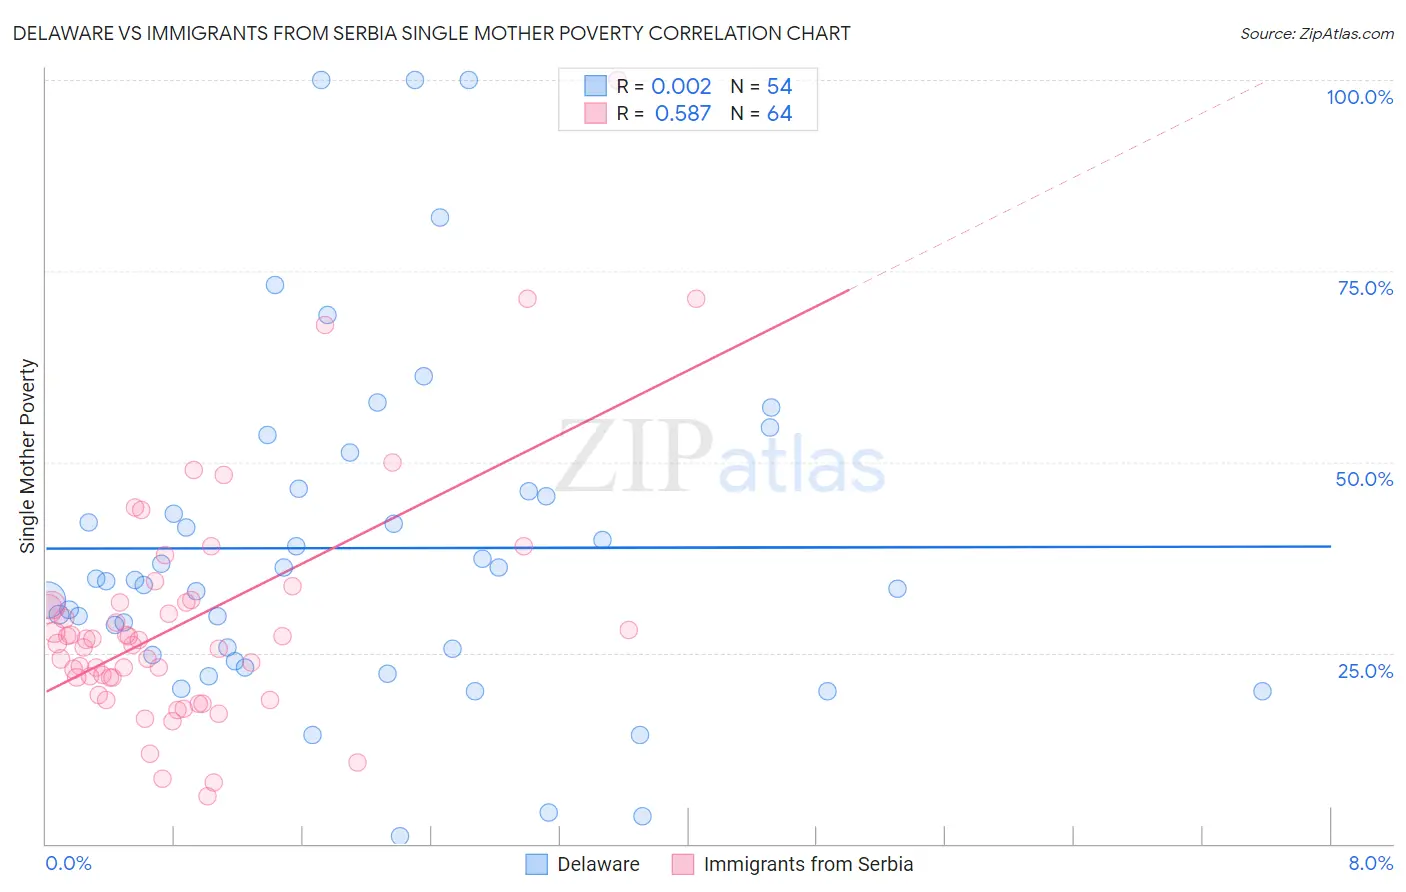
Delaware vs Immigrants from Serbia Single Mother Poverty Correlation Chart
The statistical analysis conducted on geographies consisting of 95,376,359 people shows no correlation between the proportion of Delaware and poverty level among single mothers in the United States with a correlation coefficient (R) of 0.002 and weighted average of 31.8%. Similarly, the statistical analysis conducted on geographies consisting of 130,174,648 people shows a substantial positive correlation between the proportion of Immigrants from Serbia and poverty level among single mothers in the United States with a correlation coefficient (R) of 0.587 and weighted average of 26.9%, a difference of 18.4%.
Single Mother Poverty Correlation Summary
| Measurement | Delaware | Immigrants from Serbia |
| Minimum | 1.1% | 6.2% |
| Maximum | 100.0% | 100.0% |
| Range | 98.9% | 93.8% |
| Mean | 38.7% | 29.2% |
| Median | 34.5% | 26.4% |
| Interquartile 25% (IQ1) | 24.8% | 21.8% |
| Interquartile 75% (IQ3) | 46.2% | 31.6% |
| Interquartile Range (IQR) | 21.4% | 9.8% |
| Standard Deviation (Sample) | 22.2% | 15.9% |
| Standard Deviation (Population) | 21.9% | 15.8% |
Similar Demographics by Single Mother Poverty
Demographics Similar to Delaware by Single Mother Poverty
In terms of single mother poverty, the demographic groups most similar to Delaware are Central American (31.8%, a difference of 0.16%), Mexican American Indian (31.9%, a difference of 0.21%), Bangladeshi (31.7%, a difference of 0.35%), Immigrants from Zaire (32.0%, a difference of 0.43%), and Fijian (31.6%, a difference of 0.58%).
| Demographics | Rating | Rank | Single Mother Poverty |
| Scotch-Irish | 0.1 /100 | #269 | Tragic 31.5% |
| British West Indians | 0.1 /100 | #270 | Tragic 31.5% |
| Immigrants | Cabo Verde | 0.1 /100 | #271 | Tragic 31.6% |
| Immigrants | Micronesia | 0.1 /100 | #272 | Tragic 31.6% |
| Fijians | 0.1 /100 | #273 | Tragic 31.6% |
| Bangladeshis | 0.1 /100 | #274 | Tragic 31.7% |
| Central Americans | 0.1 /100 | #275 | Tragic 31.8% |
| Delaware | 0.0 /100 | #276 | Tragic 31.8% |
| Mexican American Indians | 0.0 /100 | #277 | Tragic 31.9% |
| Immigrants | Zaire | 0.0 /100 | #278 | Tragic 32.0% |
| Marshallese | 0.0 /100 | #279 | Tragic 32.1% |
| Immigrants | Nonimmigrants | 0.0 /100 | #280 | Tragic 32.2% |
| Cree | 0.0 /100 | #281 | Tragic 32.2% |
| Immigrants | Azores | 0.0 /100 | #282 | Tragic 32.2% |
| Spanish Americans | 0.0 /100 | #283 | Tragic 32.3% |
Demographics Similar to Immigrants from Serbia by Single Mother Poverty
In terms of single mother poverty, the demographic groups most similar to Immigrants from Serbia are Latvian (26.9%, a difference of 0.040%), Egyptian (26.9%, a difference of 0.060%), Immigrants from Sierra Leone (26.9%, a difference of 0.12%), Immigrants from Poland (26.9%, a difference of 0.13%), and Cambodian (27.0%, a difference of 0.22%).
| Demographics | Rating | Rank | Single Mother Poverty |
| Sri Lankans | 99.9 /100 | #39 | Exceptional 26.7% |
| Immigrants | Vietnam | 99.9 /100 | #40 | Exceptional 26.7% |
| Immigrants | Greece | 99.9 /100 | #41 | Exceptional 26.7% |
| Armenians | 99.9 /100 | #42 | Exceptional 26.8% |
| Tsimshian | 99.9 /100 | #43 | Exceptional 26.8% |
| Immigrants | Sierra Leone | 99.9 /100 | #44 | Exceptional 26.9% |
| Latvians | 99.9 /100 | #45 | Exceptional 26.9% |
| Immigrants | Serbia | 99.9 /100 | #46 | Exceptional 26.9% |
| Egyptians | 99.8 /100 | #47 | Exceptional 26.9% |
| Immigrants | Poland | 99.8 /100 | #48 | Exceptional 26.9% |
| Cambodians | 99.8 /100 | #49 | Exceptional 27.0% |
| Laotians | 99.8 /100 | #50 | Exceptional 27.0% |
| Immigrants | Argentina | 99.7 /100 | #51 | Exceptional 27.1% |
| Immigrants | South Eastern Asia | 99.7 /100 | #52 | Exceptional 27.1% |
| Immigrants | Jordan | 99.7 /100 | #53 | Exceptional 27.1% |