Danish vs Cuban Single Mother Poverty
COMPARE
Danish
Cuban
Single Mother Poverty
Single Mother Poverty Comparison
Danes
Cubans
28.5%
SINGLE MOTHER POVERTY
87.1/ 100
METRIC RATING
141st/ 347
METRIC RANK
29.6%
SINGLE MOTHER POVERTY
20.8/ 100
METRIC RATING
199th/ 347
METRIC RANK
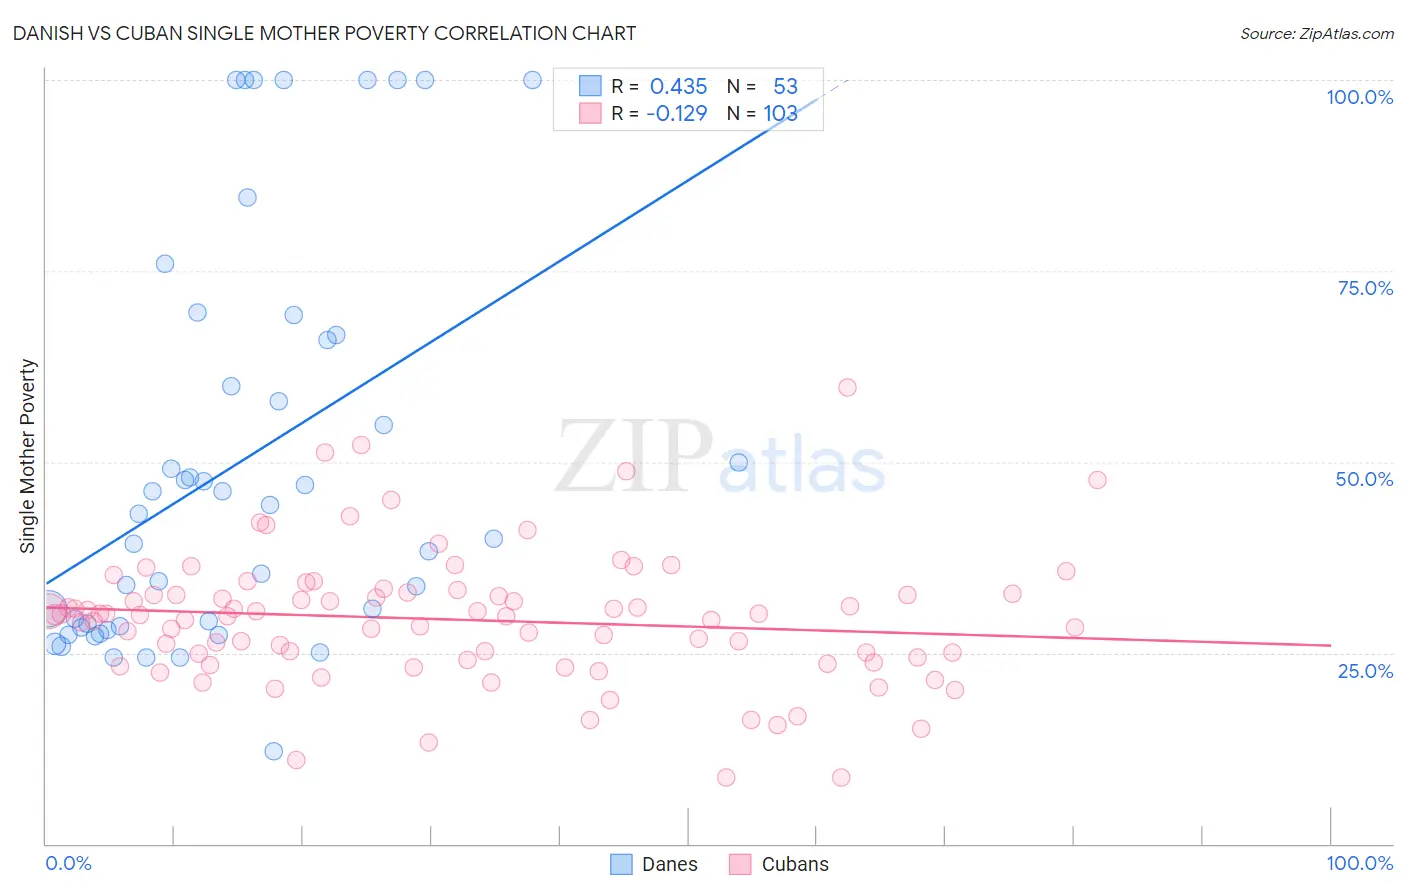
Danish vs Cuban Single Mother Poverty Correlation Chart
The statistical analysis conducted on geographies consisting of 456,210,037 people shows a moderate positive correlation between the proportion of Danes and poverty level among single mothers in the United States with a correlation coefficient (R) of 0.435 and weighted average of 28.5%. Similarly, the statistical analysis conducted on geographies consisting of 437,360,929 people shows a poor negative correlation between the proportion of Cubans and poverty level among single mothers in the United States with a correlation coefficient (R) of -0.129 and weighted average of 29.6%, a difference of 4.0%.
Single Mother Poverty Correlation Summary
| Measurement | Danish | Cuban |
| Minimum | 12.1% | 8.7% |
| Maximum | 100.0% | 59.8% |
| Range | 87.9% | 51.1% |
| Mean | 49.7% | 29.3% |
| Median | 43.2% | 29.9% |
| Interquartile 25% (IQ1) | 28.4% | 24.0% |
| Interquartile 75% (IQ3) | 66.3% | 32.7% |
| Interquartile Range (IQR) | 37.9% | 8.7% |
| Standard Deviation (Sample) | 26.1% | 8.7% |
| Standard Deviation (Population) | 25.9% | 8.7% |
Similar Demographics by Single Mother Poverty
Demographics Similar to Danes by Single Mother Poverty
In terms of single mother poverty, the demographic groups most similar to Danes are South African (28.5%, a difference of 0.050%), Immigrants from North America (28.5%, a difference of 0.060%), Luxembourger (28.5%, a difference of 0.070%), Immigrants from Colombia (28.5%, a difference of 0.10%), and Samoan (28.5%, a difference of 0.11%).
| Demographics | Rating | Rank | Single Mother Poverty |
| Immigrants | Southern Europe | 89.2 /100 | #134 | Excellent 28.4% |
| Immigrants | Spain | 89.2 /100 | #135 | Excellent 28.4% |
| Native Hawaiians | 88.9 /100 | #136 | Excellent 28.4% |
| Immigrants | Canada | 88.9 /100 | #137 | Excellent 28.4% |
| Immigrants | Belgium | 88.5 /100 | #138 | Excellent 28.5% |
| Samoans | 88.1 /100 | #139 | Excellent 28.5% |
| Immigrants | Colombia | 88.0 /100 | #140 | Excellent 28.5% |
| Danes | 87.1 /100 | #141 | Excellent 28.5% |
| South Africans | 86.6 /100 | #142 | Excellent 28.5% |
| Immigrants | North America | 86.5 /100 | #143 | Excellent 28.5% |
| Luxembourgers | 86.4 /100 | #144 | Excellent 28.5% |
| Immigrants | South America | 86.1 /100 | #145 | Excellent 28.5% |
| Immigrants | Denmark | 86.1 /100 | #146 | Excellent 28.5% |
| Immigrants | Lebanon | 85.3 /100 | #147 | Excellent 28.6% |
| Syrians | 85.3 /100 | #148 | Excellent 28.6% |
Demographics Similar to Cubans by Single Mother Poverty
In terms of single mother poverty, the demographic groups most similar to Cubans are Panamanian (29.6%, a difference of 0.050%), Trinidadian and Tobagonian (29.6%, a difference of 0.070%), Immigrants from Jamaica (29.6%, a difference of 0.080%), Belgian (29.7%, a difference of 0.15%), and Spanish American Indian (29.6%, a difference of 0.18%).
| Demographics | Rating | Rank | Single Mother Poverty |
| Moroccans | 28.6 /100 | #192 | Fair 29.5% |
| Basques | 28.3 /100 | #193 | Fair 29.5% |
| Icelanders | 26.1 /100 | #194 | Fair 29.5% |
| Slavs | 24.5 /100 | #195 | Fair 29.6% |
| Spanish American Indians | 23.4 /100 | #196 | Fair 29.6% |
| Immigrants | Jamaica | 22.0 /100 | #197 | Fair 29.6% |
| Trinidadians and Tobagonians | 21.7 /100 | #198 | Fair 29.6% |
| Cubans | 20.8 /100 | #199 | Fair 29.6% |
| Panamanians | 20.0 /100 | #200 | Fair 29.6% |
| Belgians | 18.8 /100 | #201 | Poor 29.7% |
| Malaysians | 17.4 /100 | #202 | Poor 29.7% |
| Swiss | 17.2 /100 | #203 | Poor 29.7% |
| Immigrants | Immigrants | 16.6 /100 | #204 | Poor 29.7% |
| Czechoslovakians | 16.1 /100 | #205 | Poor 29.7% |
| Immigrants | Haiti | 15.8 /100 | #206 | Poor 29.7% |