Danish vs Immigrants from Northern Europe Single Mother Poverty
COMPARE
Danish
Immigrants from Northern Europe
Single Mother Poverty
Single Mother Poverty Comparison
Danes
Immigrants from Northern Europe
28.5%
SINGLE MOTHER POVERTY
87.1/ 100
METRIC RATING
141st/ 347
METRIC RANK
27.3%
SINGLE MOTHER POVERTY
99.5/ 100
METRIC RATING
63rd/ 347
METRIC RANK
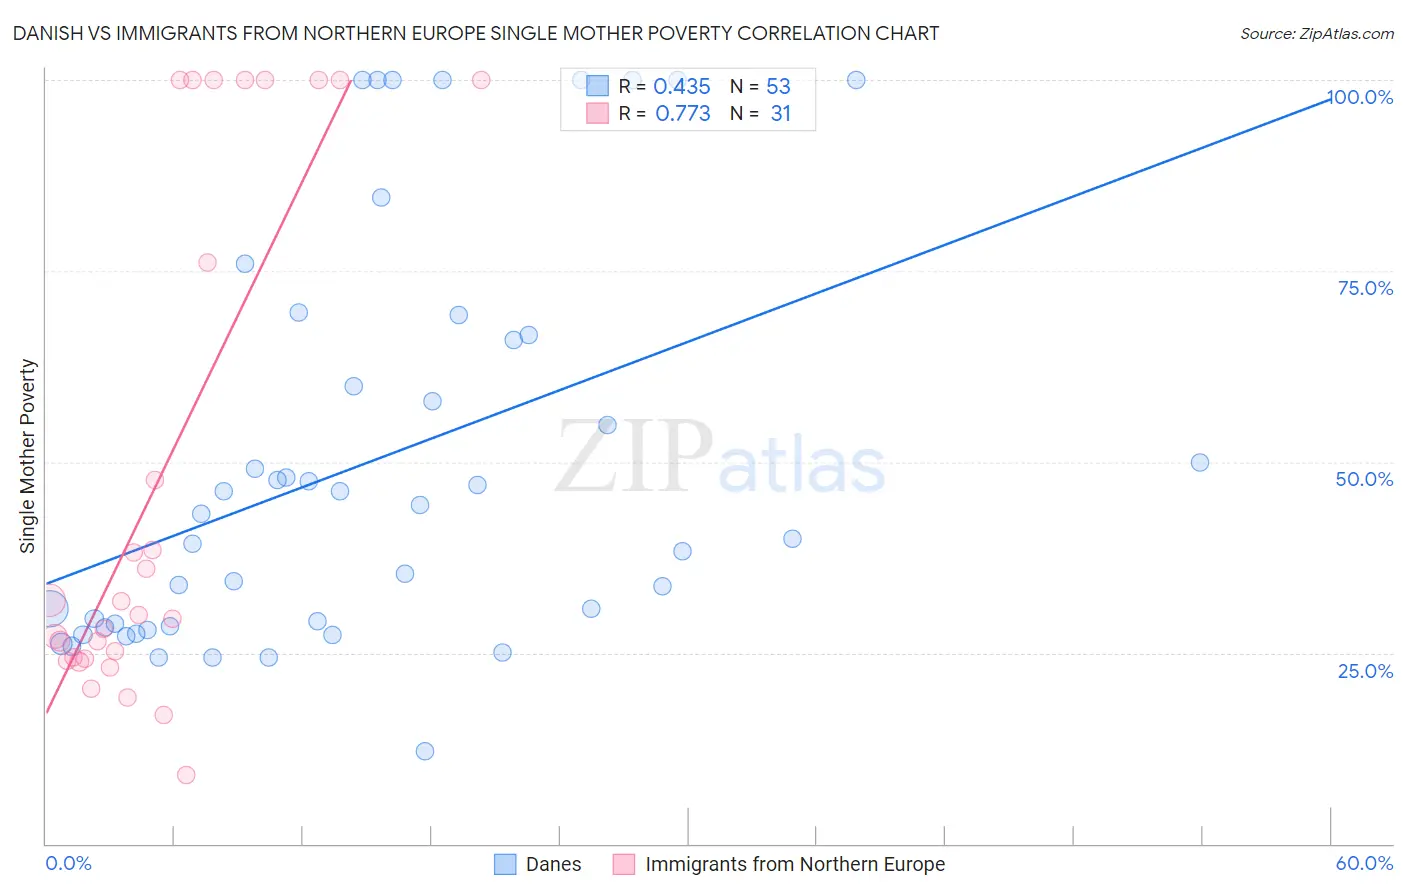
Danish vs Immigrants from Northern Europe Single Mother Poverty Correlation Chart
The statistical analysis conducted on geographies consisting of 456,210,037 people shows a moderate positive correlation between the proportion of Danes and poverty level among single mothers in the United States with a correlation coefficient (R) of 0.435 and weighted average of 28.5%. Similarly, the statistical analysis conducted on geographies consisting of 459,610,123 people shows a strong positive correlation between the proportion of Immigrants from Northern Europe and poverty level among single mothers in the United States with a correlation coefficient (R) of 0.773 and weighted average of 27.3%, a difference of 4.4%.
Single Mother Poverty Correlation Summary
| Measurement | Danish | Immigrants from Northern Europe |
| Minimum | 12.1% | 9.1% |
| Maximum | 100.0% | 100.0% |
| Range | 87.9% | 90.9% |
| Mean | 49.7% | 47.7% |
| Median | 43.2% | 29.9% |
| Interquartile 25% (IQ1) | 28.4% | 24.2% |
| Interquartile 75% (IQ3) | 66.3% | 100.0% |
| Interquartile Range (IQR) | 37.9% | 75.8% |
| Standard Deviation (Sample) | 26.1% | 33.3% |
| Standard Deviation (Population) | 25.9% | 32.7% |
Similar Demographics by Single Mother Poverty
Demographics Similar to Danes by Single Mother Poverty
In terms of single mother poverty, the demographic groups most similar to Danes are South African (28.5%, a difference of 0.050%), Immigrants from North America (28.5%, a difference of 0.060%), Luxembourger (28.5%, a difference of 0.070%), Immigrants from Colombia (28.5%, a difference of 0.10%), and Samoan (28.5%, a difference of 0.11%).
| Demographics | Rating | Rank | Single Mother Poverty |
| Immigrants | Southern Europe | 89.2 /100 | #134 | Excellent 28.4% |
| Immigrants | Spain | 89.2 /100 | #135 | Excellent 28.4% |
| Native Hawaiians | 88.9 /100 | #136 | Excellent 28.4% |
| Immigrants | Canada | 88.9 /100 | #137 | Excellent 28.4% |
| Immigrants | Belgium | 88.5 /100 | #138 | Excellent 28.5% |
| Samoans | 88.1 /100 | #139 | Excellent 28.5% |
| Immigrants | Colombia | 88.0 /100 | #140 | Excellent 28.5% |
| Danes | 87.1 /100 | #141 | Excellent 28.5% |
| South Africans | 86.6 /100 | #142 | Excellent 28.5% |
| Immigrants | North America | 86.5 /100 | #143 | Excellent 28.5% |
| Luxembourgers | 86.4 /100 | #144 | Excellent 28.5% |
| Immigrants | South America | 86.1 /100 | #145 | Excellent 28.5% |
| Immigrants | Denmark | 86.1 /100 | #146 | Excellent 28.5% |
| Immigrants | Lebanon | 85.3 /100 | #147 | Excellent 28.6% |
| Syrians | 85.3 /100 | #148 | Excellent 28.6% |
Demographics Similar to Immigrants from Northern Europe by Single Mother Poverty
In terms of single mother poverty, the demographic groups most similar to Immigrants from Northern Europe are Russian (27.3%, a difference of 0.030%), Immigrants from Malaysia (27.3%, a difference of 0.050%), Immigrants from Turkey (27.3%, a difference of 0.11%), Soviet Union (27.3%, a difference of 0.15%), and Immigrants from Australia (27.3%, a difference of 0.17%).
| Demographics | Rating | Rank | Single Mother Poverty |
| Immigrants | Romania | 99.7 /100 | #56 | Exceptional 27.2% |
| Palestinians | 99.7 /100 | #57 | Exceptional 27.2% |
| Argentineans | 99.6 /100 | #58 | Exceptional 27.2% |
| Paraguayans | 99.6 /100 | #59 | Exceptional 27.2% |
| Eastern Europeans | 99.6 /100 | #60 | Exceptional 27.2% |
| Immigrants | Eastern Europe | 99.6 /100 | #61 | Exceptional 27.2% |
| Immigrants | Malaysia | 99.5 /100 | #62 | Exceptional 27.3% |
| Immigrants | Northern Europe | 99.5 /100 | #63 | Exceptional 27.3% |
| Russians | 99.5 /100 | #64 | Exceptional 27.3% |
| Immigrants | Turkey | 99.5 /100 | #65 | Exceptional 27.3% |
| Soviet Union | 99.5 /100 | #66 | Exceptional 27.3% |
| Immigrants | Australia | 99.5 /100 | #67 | Exceptional 27.3% |
| Immigrants | Czechoslovakia | 99.5 /100 | #68 | Exceptional 27.4% |
| Lithuanians | 99.4 /100 | #69 | Exceptional 27.4% |
| Immigrants | Belarus | 99.4 /100 | #70 | Exceptional 27.4% |