Cypriot vs Austrian Single Mother Poverty
COMPARE
Cypriot
Austrian
Single Mother Poverty
Single Mother Poverty Comparison
Cypriots
Austrians
28.3%
SINGLE MOTHER POVERTY
92.3/ 100
METRIC RATING
120th/ 347
METRIC RANK
28.7%
SINGLE MOTHER POVERTY
79.0/ 100
METRIC RATING
152nd/ 347
METRIC RANK
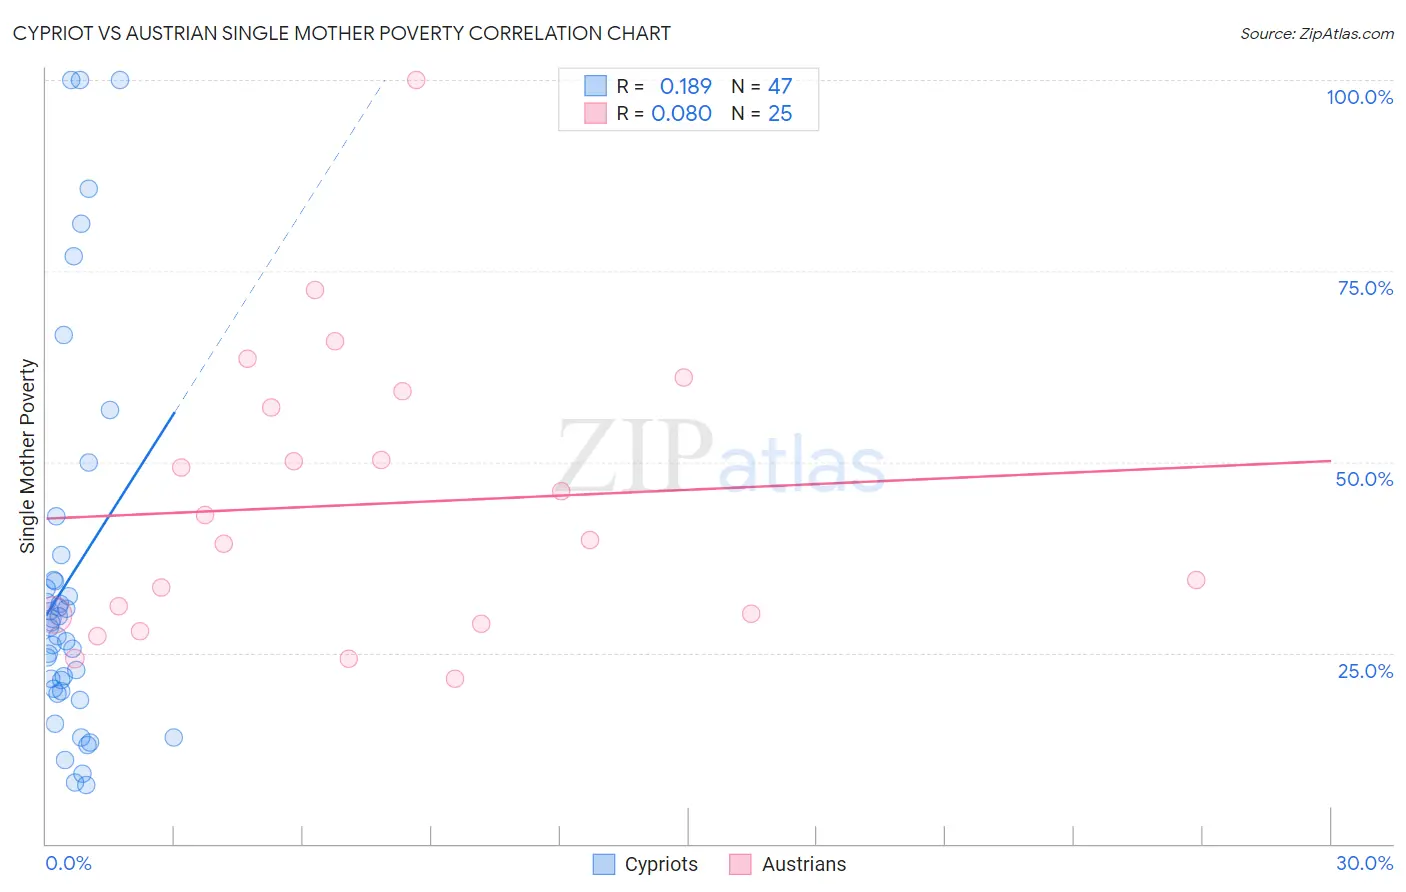
Cypriot vs Austrian Single Mother Poverty Correlation Chart
The statistical analysis conducted on geographies consisting of 61,106,831 people shows a poor positive correlation between the proportion of Cypriots and poverty level among single mothers in the United States with a correlation coefficient (R) of 0.189 and weighted average of 28.3%. Similarly, the statistical analysis conducted on geographies consisting of 435,772,358 people shows a slight positive correlation between the proportion of Austrians and poverty level among single mothers in the United States with a correlation coefficient (R) of 0.080 and weighted average of 28.7%, a difference of 1.4%.
Single Mother Poverty Correlation Summary
| Measurement | Cypriot | Austrian |
| Minimum | 7.7% | 21.6% |
| Maximum | 100.0% | 100.0% |
| Range | 92.3% | 78.4% |
| Mean | 34.7% | 44.4% |
| Median | 28.2% | 39.8% |
| Interquartile 25% (IQ1) | 20.0% | 29.3% |
| Interquartile 75% (IQ3) | 34.6% | 58.2% |
| Interquartile Range (IQR) | 14.7% | 28.8% |
| Standard Deviation (Sample) | 24.8% | 18.8% |
| Standard Deviation (Population) | 24.5% | 18.4% |
Similar Demographics by Single Mother Poverty
Demographics Similar to Cypriots by Single Mother Poverty
In terms of single mother poverty, the demographic groups most similar to Cypriots are Immigrants from Syria (28.3%, a difference of 0.020%), Brazilian (28.3%, a difference of 0.030%), Australian (28.3%, a difference of 0.040%), Immigrants from Afghanistan (28.3%, a difference of 0.040%), and Immigrants from Uganda (28.3%, a difference of 0.050%).
| Demographics | Rating | Rank | Single Mother Poverty |
| Immigrants | South Africa | 93.2 /100 | #113 | Exceptional 28.3% |
| Immigrants | Western Asia | 92.7 /100 | #114 | Exceptional 28.3% |
| Immigrants | Kuwait | 92.7 /100 | #115 | Exceptional 28.3% |
| Immigrants | Uganda | 92.5 /100 | #116 | Exceptional 28.3% |
| Australians | 92.5 /100 | #117 | Exceptional 28.3% |
| Brazilians | 92.4 /100 | #118 | Exceptional 28.3% |
| Immigrants | Syria | 92.4 /100 | #119 | Exceptional 28.3% |
| Cypriots | 92.3 /100 | #120 | Exceptional 28.3% |
| Immigrants | Afghanistan | 92.1 /100 | #121 | Exceptional 28.3% |
| Colombians | 91.8 /100 | #122 | Exceptional 28.3% |
| Uruguayans | 91.7 /100 | #123 | Exceptional 28.3% |
| Immigrants | Switzerland | 91.7 /100 | #124 | Exceptional 28.3% |
| Kenyans | 90.9 /100 | #125 | Exceptional 28.4% |
| Immigrants | Chile | 90.8 /100 | #126 | Exceptional 28.4% |
| Poles | 90.8 /100 | #127 | Exceptional 28.4% |
Demographics Similar to Austrians by Single Mother Poverty
In terms of single mother poverty, the demographic groups most similar to Austrians are Immigrants from Oceania (28.7%, a difference of 0.070%), Slovene (28.8%, a difference of 0.18%), Northern European (28.6%, a difference of 0.21%), Portuguese (28.8%, a difference of 0.39%), and Ugandan (28.8%, a difference of 0.47%).
| Demographics | Rating | Rank | Single Mother Poverty |
| Immigrants | South America | 86.1 /100 | #145 | Excellent 28.5% |
| Immigrants | Denmark | 86.1 /100 | #146 | Excellent 28.5% |
| Immigrants | Lebanon | 85.3 /100 | #147 | Excellent 28.6% |
| Syrians | 85.3 /100 | #148 | Excellent 28.6% |
| Serbians | 85.0 /100 | #149 | Excellent 28.6% |
| Northern Europeans | 81.7 /100 | #150 | Excellent 28.6% |
| Immigrants | Oceania | 79.9 /100 | #151 | Good 28.7% |
| Austrians | 79.0 /100 | #152 | Good 28.7% |
| Slovenes | 76.4 /100 | #153 | Good 28.8% |
| Portuguese | 73.2 /100 | #154 | Good 28.8% |
| Ugandans | 71.7 /100 | #155 | Good 28.8% |
| Iraqis | 71.5 /100 | #156 | Good 28.8% |
| Immigrants | Western Europe | 71.1 /100 | #157 | Good 28.9% |
| Immigrants | Hungary | 70.6 /100 | #158 | Good 28.9% |
| Czechs | 68.4 /100 | #159 | Good 28.9% |